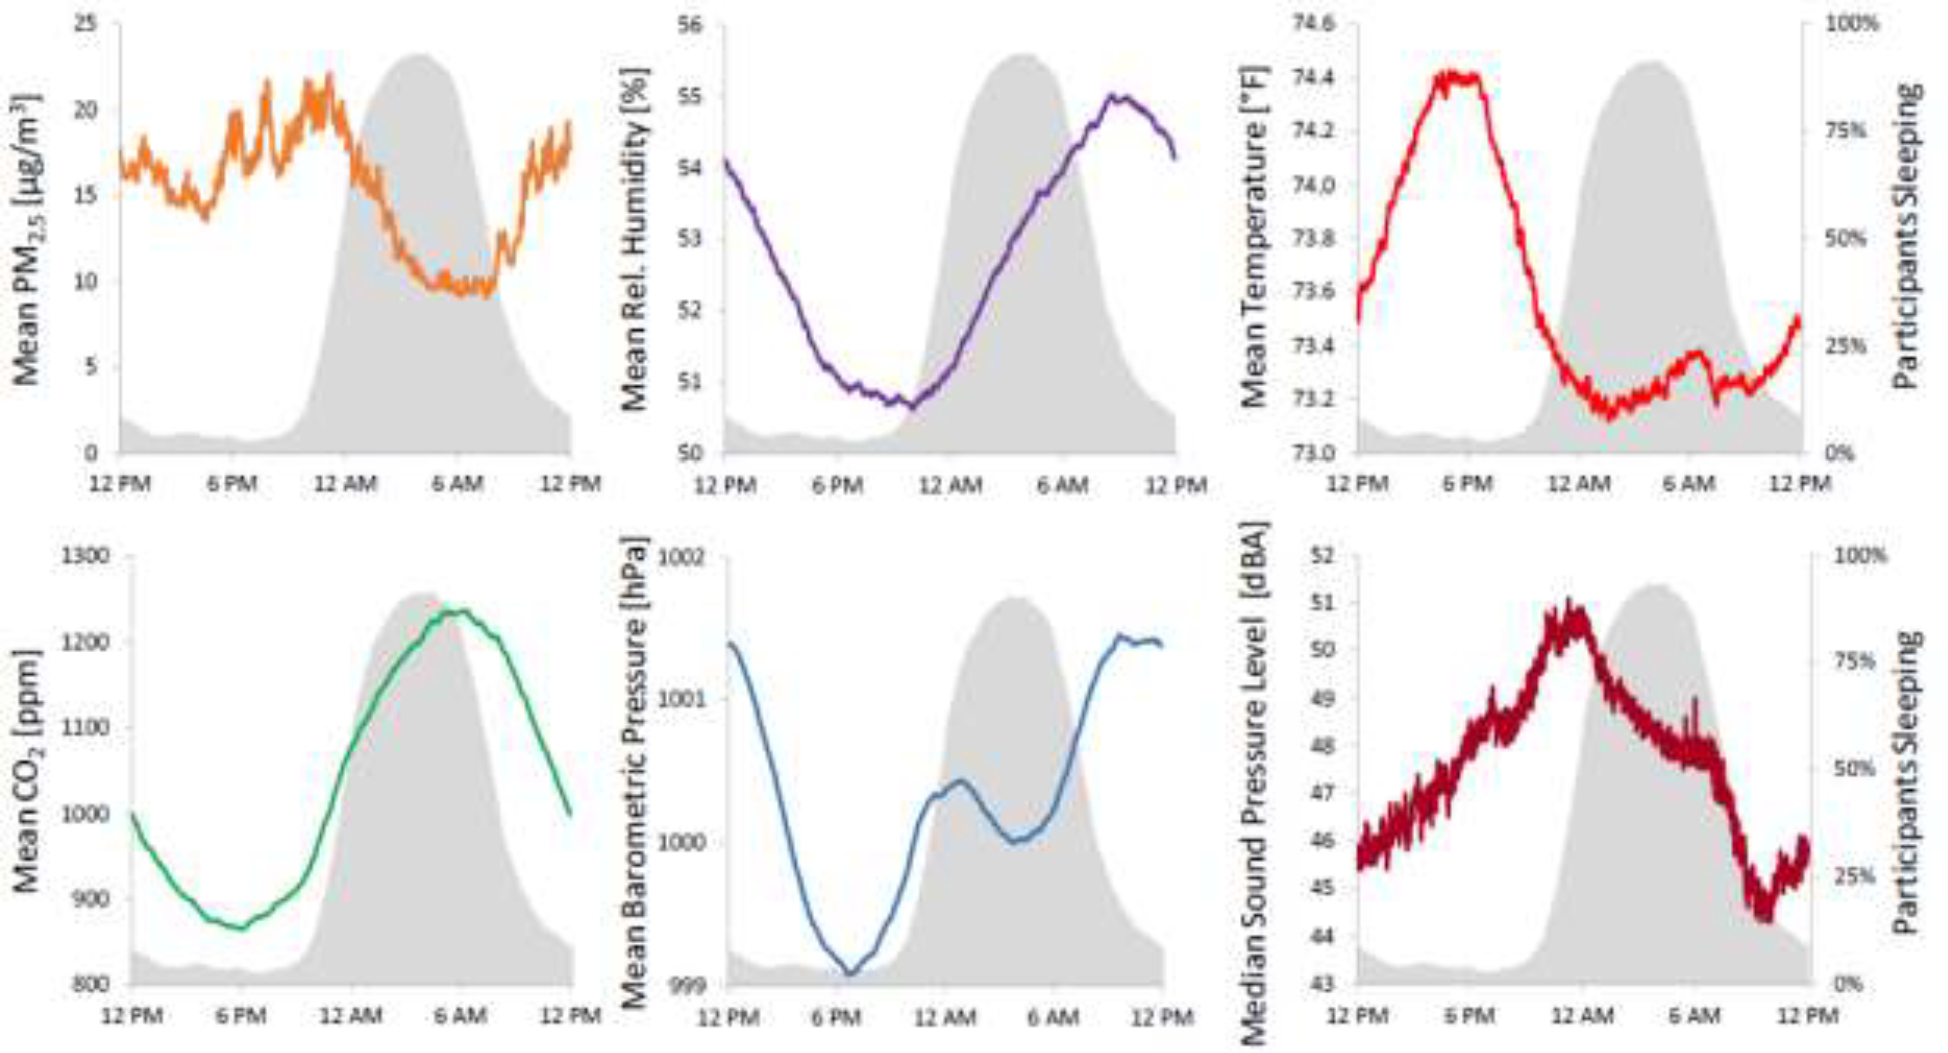
Figure 1:

Bedroom environment by time of day. Values of mean fine particulate matter (PM2.5), mean relative humidity, mean temperature, mean CO2, mean barometric pressure, and median sound pressure levels are plotted against time of day (the median was chosen for sound pressure levels as they are strongly affected by outliers). Values were derived from all subjects with valid air quality and sound level data. Percent of participants sleeping is shown in gray. PM2.5 and sound pressure levels show decreasing trends, humidity and CO2 show increasing trends while temperature and barometric pressure show a slightly decreasing followed by a slightly increasing trend during participants’ sleep periods.
