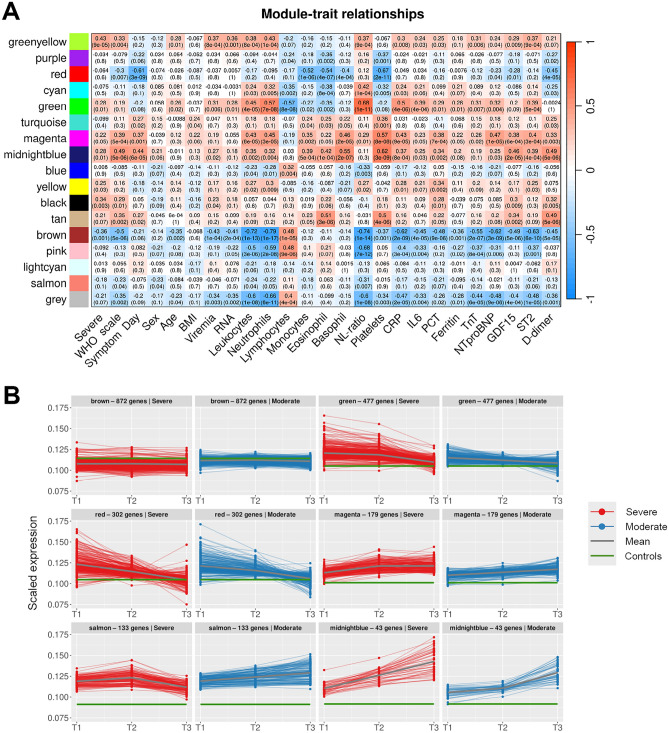
Figure 4.
WGCNA. (A) Correlations between WGCNA gene modules and clinical traits. For each correlation, the correlation coefficient and p-value (in parentheses) are provided. Positive correlations are in red, negative in blue. (B) Trajectories of genes in WGCNA modules associated with WHO severity score. Remaining trajectories are presented in Supplementary Fig. 7. Scaled gene expression in each module is coloured by patient group: severe in red, moderate in blue. Mean expression in patients is indicated by a thick grey line, mean expression in healthy controls by a green line.

