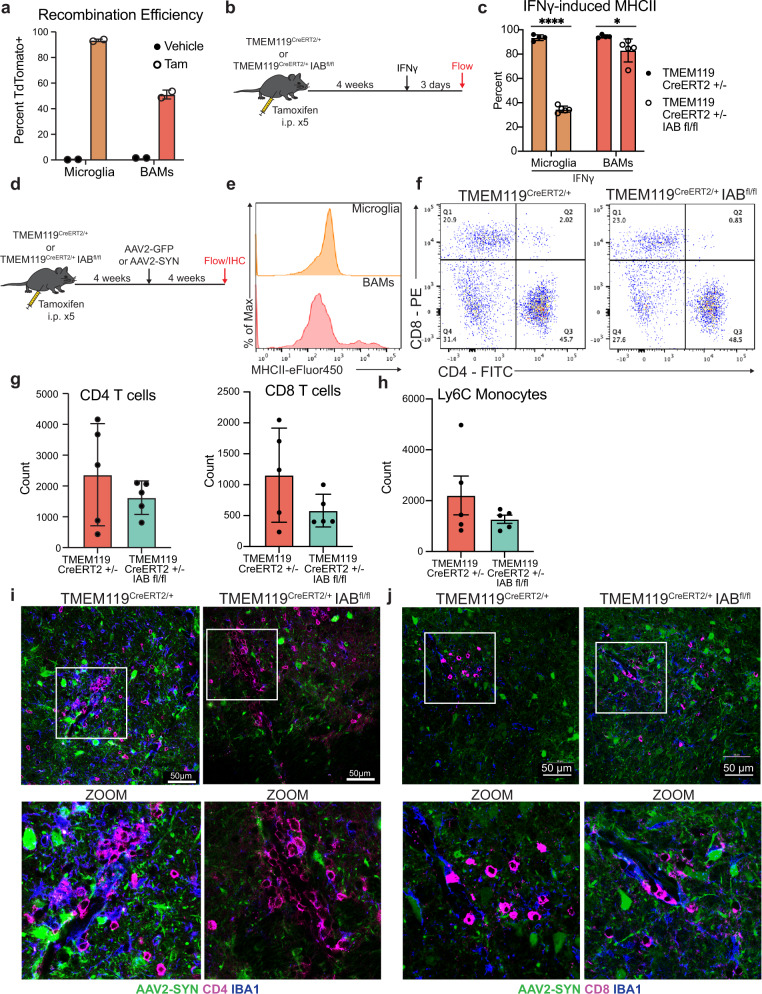
Fig. 3. Microglial class II antigen presentation is dispensable for alpha-synuclein-induced T-cell infiltration.
a Fate mapping experiment to determine the baseline and inducible recombination efficiency of CRMs in TMEM119CreERT2/+ TdTomatofl/fl. Percent of cells that are TdTomato+ are displayed. N = 2 mice per treatment group. Mean ± SEM is displayed. Representative results of two independent experiments are shown. b Experimental paradigm designed to test microglial-specific tamoxifen-induced deletion of the Iab locus. Because baseline microglial MHCII expression is low, mice were given intra-nigral IFNγ at 4 weeks post-tamoxifen treatment, and microglial MHCII expression was assayed 3 days post injection. c Quantification of MHCII expression by CRMs, including microglia and BAMs, following IFNγ treatment. Percent of cells expressing MHCII are shown. N = 4 TMEM119 CreERT2/+ and 5 per TMEM119 CreERT2/+ Iab fl/fl mice per group. Two-way ANOVA with Tukey’s multiple comparison test, *p = 0.0291, ****p < 0.0001, mean ± SD is shown. Representative results of one independent experiment are shown. d Experimental paradigm for conditional Iab deletion from TMEM119+ cells. Mice received tamoxifen and 4 weeks later were given AAV2-SYN. Four weeks post AAV2-SYN, flow cytometry and immunohistochemistry were performed. e Representative histograms displaying MHCII expression on microglia and BAMs in AAV2-GFP and AAV2-SYN conditions. Y axis represents percent of maximum to allow comparison between differently sized populations. X axis displays MHCII intensity. f Representative flow plots of brain-infiltrating CD4+ or CD8+ T cells in TMEM119CreERT2/+ IABfl/fl mice or TMEM119CreERT2/+ control mice. Representative results from one independent experiment. g Quantification of (f). n = 5 per group, with one ventral midbrain per n. Mean ± SD is shown. h Quantification of infiltrating Ly6C hi monocytes in TMEM119CreERT2/+ IABfl/fl mice or TMEM119CreERT2/+ control mice 4 weeks after AAV2-SYN. N = 5 per group, with one ventral midbrain per n. Mean ± SD is shown. Representative results from one independent experiment. i Immunofluorescent images of CD4+ T cell infiltration in TMEM119CreERT2/+ IABfl/fl mice or TMEM119CreERT2/+ control mice. Tissues are labeled with CD4 (magenta), AAV2-SYN (green), and IBA1 (blue). Images taken at ×40 magnification (top) and digitally zoomed (bottom). Representative images from one experiment are shown and meant to corroborate flow cytometry results. j Immunofluorescent images of CD8+ infiltration in TMEM119CreERT2/+ IABfl/fl mice or TMEM119CreERT2/+ control mice. Tissues are labeled with CD8 (magenta), AAV2-SYN (green), and IBA1 (blue). Images taken at ×40 magnification (top) and digitally zoomed (bottom). Representative images from one experiment are shown and meant to corroborate flow cytometry results. *Source data is provided in the “Source data” file.

