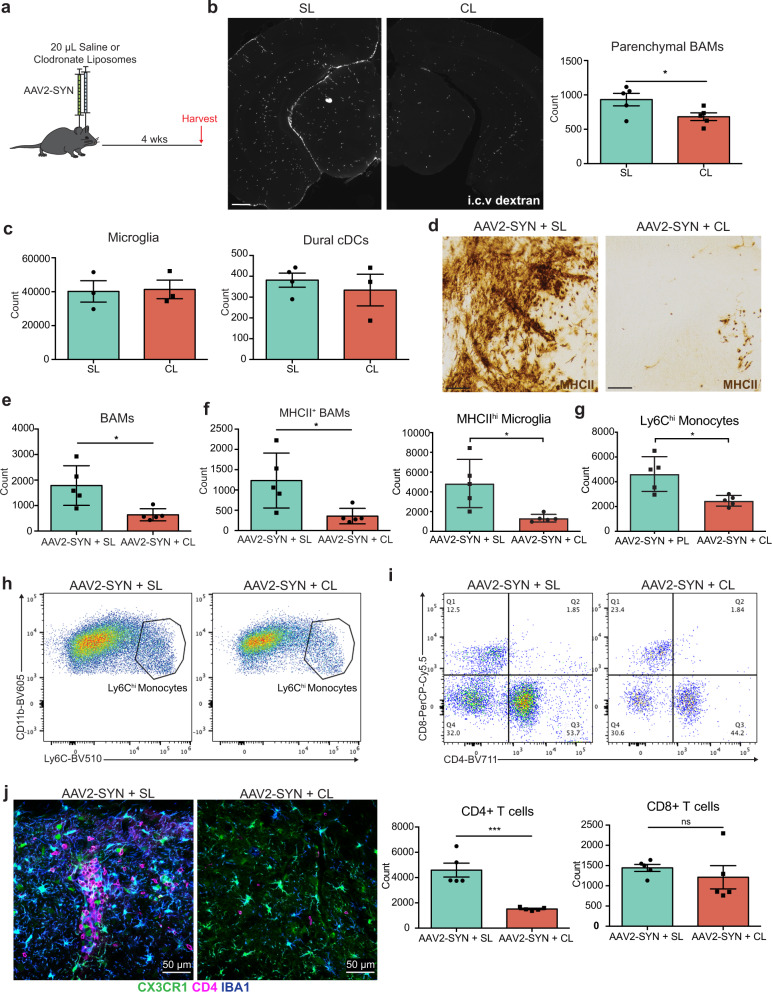
Fig. 5. Specific depletion of border-associated macrophages prevents alpha-synuclein induced neuroinflammation.
a Experimental paradigm for Clodronate Liposome (CL) BAM depletion in combination with AAV2-SYN administration. Flow cytometry and IHC are performed 4 weeks post administration. b Left: Tiled fluorescent images demonstrating BAM depletion within the ventral midbrain 7 days after CL or Saline Liposome (SL) administration. BAMs are marked with dextran that was administered i.c.v. 24 h prior to sacrifice (white). Right: flow cytometric quantification of BAM depletion with CL. BAMs are gated as live, CD45+ CD11b+ CX3CR1+ Ly6C- and CD38+. Scale bar is 500 µm. Unpaired T-test, two-tailed, n = 5 samples per group with 2 ventral midbrains pooled per sample. *p = 0.0466. Mean ± SD is shown. Representative results from two independent experiments. c Flow cytometric quantification 7 days post CL or SL administration demonstrating that parenchymal microglia (N = 3 samples per group) and dural cDCs (N = 4 SL and 3 CL samples per group) are unaffected with treatment. Each sample comprised of 2 pooled ventral midbrains. Mean ± SD is shown. Representative results from two independent experiments. d Immunohistochemistry depicting MHCII (brown) expression within the ventral midbrain after AAV2-SYN + SL or AAV2-SYN + CL, demonstrating that BAM depletion prevents MHCII expression in the midbrain. Displayed images are cropped from larger tiled ones. Scale bar is 50 µm. Representative images are displayed from two independent experiments. e Confirmation of BAM depletion in AAV2-SYN with CL via flow cytometry. Unpaired T-test, two-tailed, n = 5 per group. *p = 0.0134. Mean ± SD is shown. Representative results from two independent experiments. f Flow cytometric quantification of MHCII+ BAM and MHCII+ microglia reduction with CL treatment. Unpaired T-test, two-tailed, n = 5 per group. *p = 0.0238 and 0.013, respectively. Mean ± SD is shown. Representative results from two independent experiments. g Quantification of infiltrating Ly6Chi monocytes in response to α-syn. Monocytes are gated as live, CD45+ CD11b+ CX3CR1- CD38- Ly6Chi. Unpaired T-test, two-tailed, n = 5 per group. *p = 0.011. Mean ± SD is shown. Representative results from two independent experiments. h Representative flow plots of (g). i Top: Representative flow plots of CD4+ and CD8+ T cell infiltration with SL or CL treatment. Below: Quantification of flow cytometry demonstrating that BAM depletion reduces CD4+ T cell infiltration. Unpaired T-test, two-tailed, n = 5 per group. ***p = 0.0005. Mean ± SD is shown. Representative results from two independent experiments. j Immunofluorescent images demonstrating reduced CD4+ T cell infiltration and myeloid activation with CL-mediated BAM depletion. Tissues are labeled with CX3CR1 (green), CD4 (magenta), and IBA1 (blue). Images were captured at ×40. *Source data is provided in the “Source data” file.

