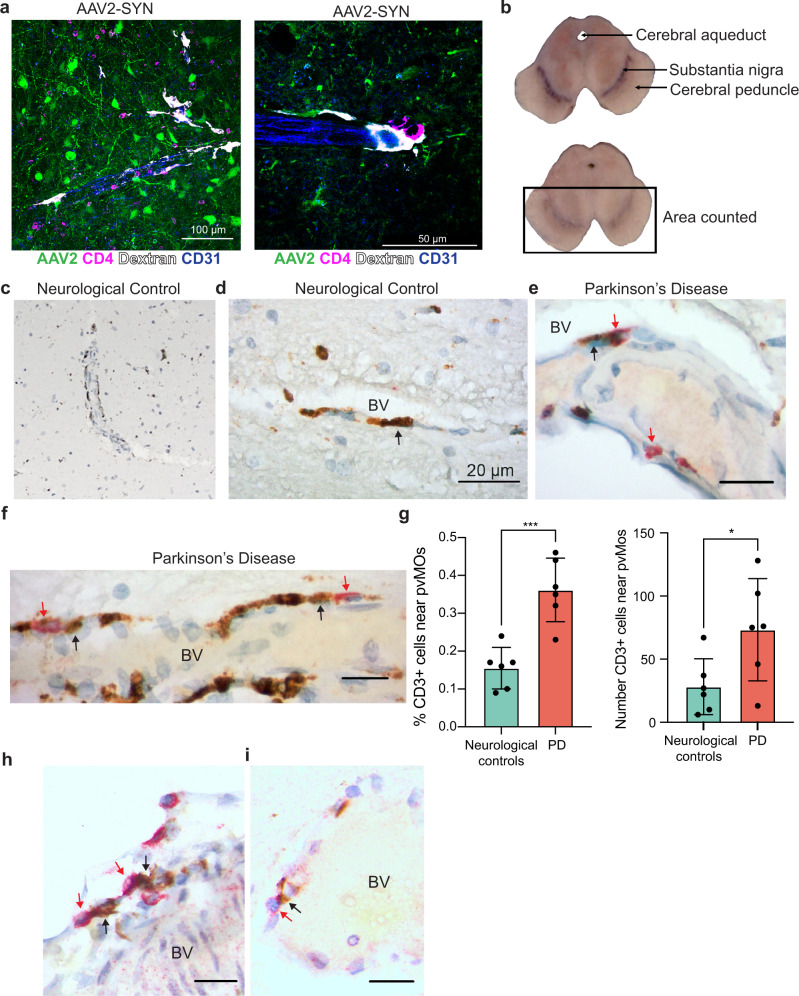
Fig. 6. Border-associated macrophages in human PD.
a Immunofluorescence showing abundance of close interactions between CD4+ T cells and perivascular macrophages in the mouse SNpc. Tissue is labeled with AAV2-SYN (green), CD4 (magenta), Dextran (white), and CD31 (blue). Images are taken at ×40 (left) and ×60 (right). b Transverse sections of midbrains from one neurological control (top) and one patient with PD (bottom), showing the anatomic landmarks of the cerebral aqueduct, substantia nigra, and cerebral peduncle. Rectangle denotes the region of interest where CD3/CD68 double immunostaining was counted. c Images of CD68+ BAMs located in the perivascular space of the substantia nigra of non-neurological disease controls, demonstrating their abundance in human brains. d High magnification demonstrating elongated, vessel-localized CD68+ BAMs in the non-neurological disease control substantia nigra. Black arrows point to BAMs. BV denotes the blood vessel. Scale bar is 20 μm. e Vessel-localized CD68+ BAMs (brown) and CD3+ T cells (red) in the substantia nigra of human PD (right). Black arrows denote BAMs, red arrows denote CD3+ T cells. BV indicates the blood vessel. Scale bars are 10 μm. f Vessel-localized CD68+ BAMs (brown) and CD3+ T cells (red) in the substantia nigra of human PD (right). Black arrows denote BAMs, red arrows denote CD3+ T cells. BV indicates the blood vessel. Scale bars are 10 μm. g Quantification of BAM – T cell interactions in human PD. The percentage of perivascular CD3+ cells adjacent to perivascular CD68+ cells was divided by the total number of CD3+ cells in the ventral midbrain of 6 DLBD patients and 6 controls. Graph displays mean values ± SD. Unpaired T test, two-sided, *p = 0.0375, ***p = 0.0005. Mean ± SD is shown. h Vessel-localized CD8+ T cells (red) and CD68+ BAMs (brown) cells in the substantia nigra of human PD. Black arrows denote BAMs, whereas red arrows denote CD8+ T cells that are in close proximity to BAMs. BV denotes blood vessel. Scale bars are 10 μm. Representative images of one experiment are displayed. i Vessel-localized CD4+ T cells (red) and CD68+ BAMs (brown) cells in the substantia nigra of human PD. Black arrows denote BAMs, red arrows denote CD4+ T cells BV denotes blood vessel. Scale bars are 10 μm. Representative images of one experiment are displayed. *Source data is provided in the “Source data” file.

