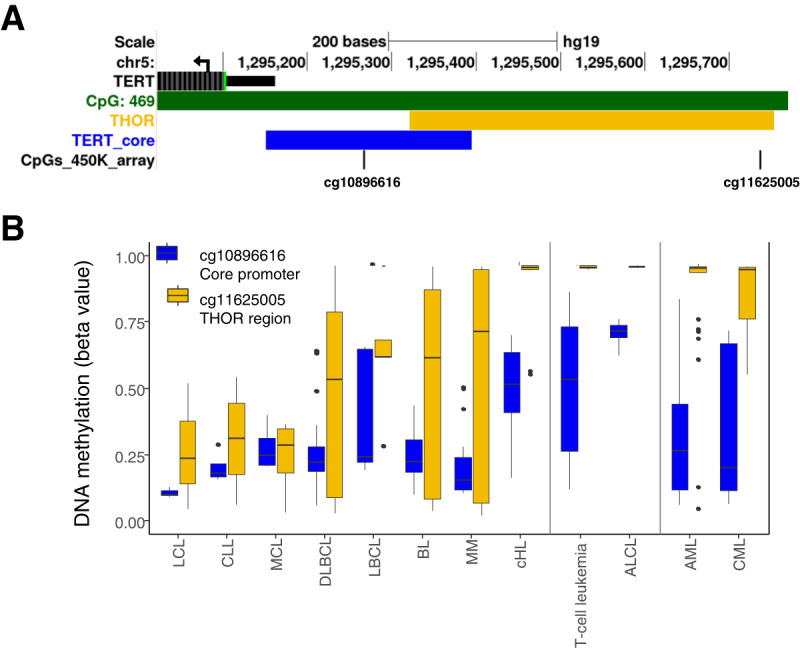
Fig. 1. TERT promoter DNA methylation in hematopoietic cell lines.

A UCSC browser view showing the TERT promoter region (5′ end of TERT gene indicated by black color with a black arrow indicating the transcription direction) and the CpG island located in this region (indicated in green color according to the CpG Islands Track from the UCSC browser). The TERT core promoter and the THOR region are indicated in blue and orange, respectively. CpGs present on the Illumina HumanMethylation 450k array are labeled with their TargetID. B DNA methylation data of 155 hematopoietic cell lines [3 lymphoblastic cell lines (LCL), 4 chronic lymphocytic leukemia (CLL), 4 mantle cell lymphoma (MCL), 33 diffuse large B-cell lymphomas (DLBCL), 5 large B-cell lymphoma (LBCL), 18 Burkitt lymphoma (BL), 16 multiple myelomas (MM), 10 classic Hodgkin lymphoma (cHL, including 2 T-lineage cell lines; HDLM-2 and L-540), 17 T-cell leukemia, 5 anaplastic large-cell lymphomas (ALCL), 29 acute myeloid leukemia (AML), 11 chronic myeloid leukemia (CML)]. DNA methylation is shown for two CpGs, one located in the TERT core promoter, and the other in the THOR. T-cell and myeloid malignancies are separated from the rest samples with black lines.
