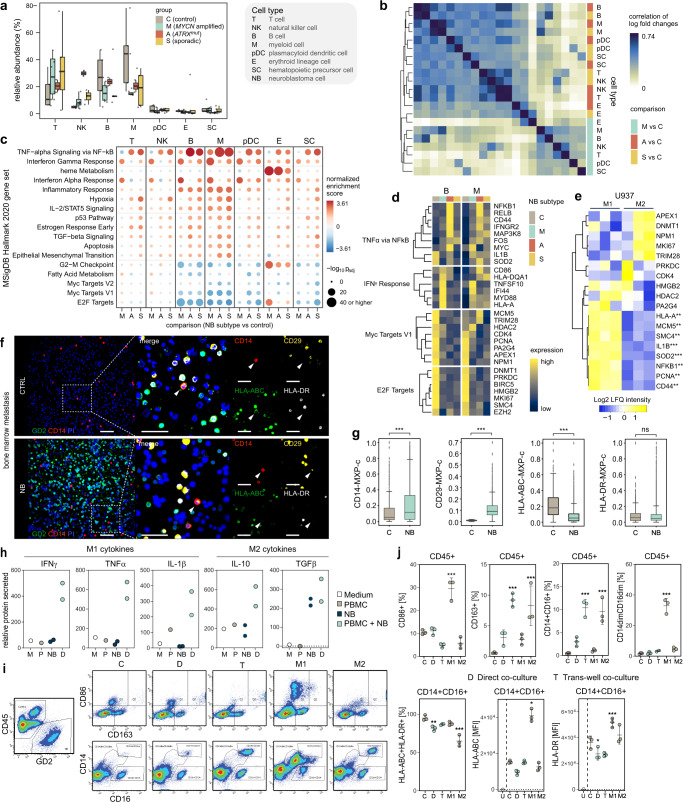
Fig. 4. Cellular composition of NB-infiltrated BM.
a Cell type abundance in NB subtypes (n = 4, 2 and 5 patients for MYCN amplified, ATRXmut, and sporadic, respectively) compared to control (n = 5 patients). b Correlation analysis of gene expression changes between NB patients and controls for BM microenvironment cell types in NB subtypes. c Gene set enrichment analysis using MSigDB Hallmark 2020 database with genes sorted according to their log-fold change of expression relative to the control group. p-values are based on an adaptive multi-level split Monte-Carlo scheme as implemented in the R package fgsea. d Expression of exemplary genes in our patient cohort for the top two enriched/depleted pathways identified in c. e Label-free protein quantitation of targets identified in d in U937 cells (n = 3 independent experiments). f, g Protein expression in monocytes and macrophages derived from multiplex images of neuroblastoma BM samples with no (control, C, n = 3 patients) and high (>200 cells, n = 5 patients) NB cell infiltration. Scale bar, 45 µm. Wilcoxon–Mann–Whitney with FDR-corrected p-values: ns not significant, **p ≤ 0.01, ***p ≤ 0.001. h Secreted levels of M1 and M2 markers in co-cultured NB cells with PBMCs (n = 2 independent experiments). i Representative FACS plots of NB cells and CD45+ populations in co-cultured NB cells and PBMCs, and controls, along with PBMCs induced to acquire an M1 or M2 phenotype at day 3. j Percentage (%) of cells expressing the M1 marker, CD86 or the M2 marker, CD163 in CD45+, CD14+ CD16+, and CD14dim CD16dim populations as well as % and MFI of MHC class I and II markers (n = 3 independent experiments). Dots show the raw data (a, g) and boxes display the median value and 25 and 75% quartiles; the whiskers are extended to the most extreme value inside the 1.5-fold interquartile range. Data were subjected to two-tailed paired Student’s t test (e) or one-way ANOVA (j, compared to control: PBMC or CLB-Ma), and corrected using Dunnett’s post hoc test for multiple comparisons. Asterisks indicate statically significant changes, *p < 0.05, **p < 0.01, ***p < 0.001. Data are presented as mean ± standard error of the mean (j). Source data are provided as a Source Data file.

