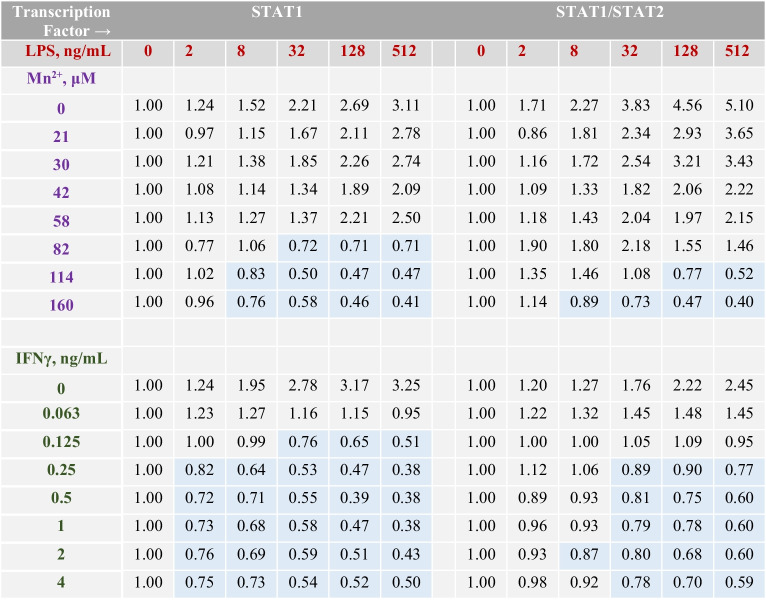
Table 3.
Relative TF activation folds in BV-2 microglia treated with combinations of LPS and Mn(II) or combinations of LPS and IFNγ for 12 h, the data points are single measurements. In each row, the activation folds are normalized to Mn(II)-only treated cells at indicated Mn(II) concentrations (Supplementary Table S3). Data highlighted in blue indicate antagonistic interactions between Mn(II) and LPS or between IFN-γ and LPS in microglia

