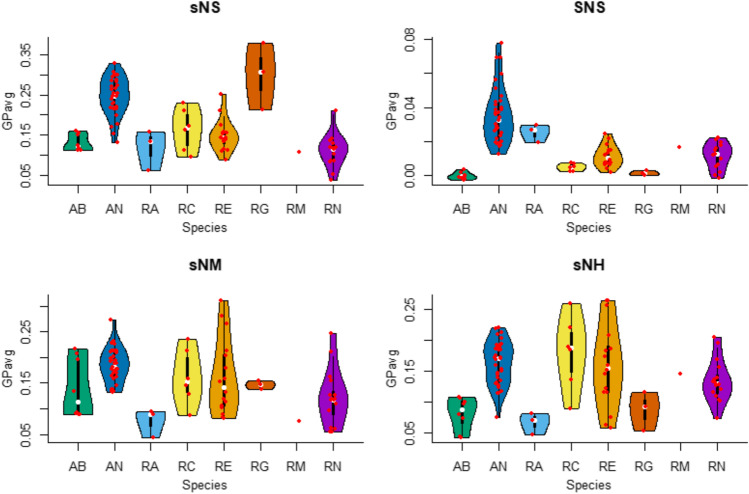
Fig. 1.
Violin plots showing the growth results, expressed as average growth performance (GPavg), in different artificial nectars of the Acinetobacter and Rosenbergiella species tested in this study. Note that, in general, the GPavg values obtained for most species in each artificial nectar were broadly distributed around the median value (white dots contained within the thick black bars representing the interquartile range [IQR] that are shown inside the violin plots). Outlier values (red dots located beyond the boundaries of the thin black lines representing 1.5 × IQR) are evident in some plots. Abbreviations: AB, Acinetobacter boissieri (n = 8); AN, Acinetobacter nectaris (n = 35); RA, Rosenbergiella australiborealis (n = 3); RC, Rosenbergiella collisarenosi (n = 6); RE, Rosenbergiella epipactidis (n = 16); RG, ‘Rosenbergiella gaditana’ (n = 3); RM, ‘Rosenbergiella metrosideri’ (n = 1); RN, Rosenbergiella nectarea (n = 16). Artificial nectar codes are as in Table 1

