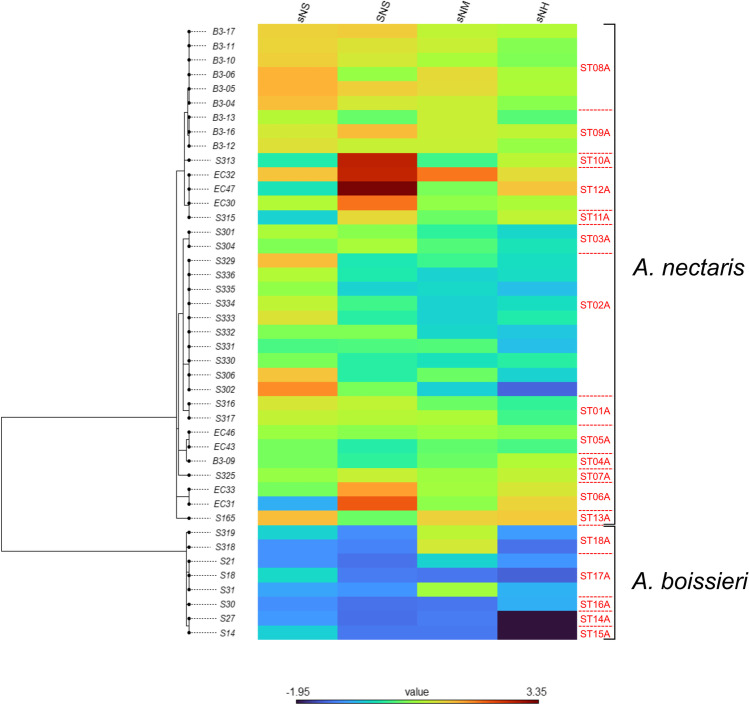
Fig. 2.
Phylogenetic heatmap of the trait values obtained for the different Acinetobacter isolates (shown in rows) in the growth assays performed in this study. Artificial nectar codes (shown in columns) are as in Table 1. The phylogenetic tree shown on the left corresponds to the maximum likelihood (ML) tree depicted in Fig. S1. The sequence type (ST; shown in red characters) and species affiliation of isolates are indicated at the right side of the heatmap (see also Table S1). Note that some clade dependence of the trait values (growth in the four artificial nectars under analysis) is observed, with A. boissieri isolates displaying in most cases lower trait values than A. nectaris

