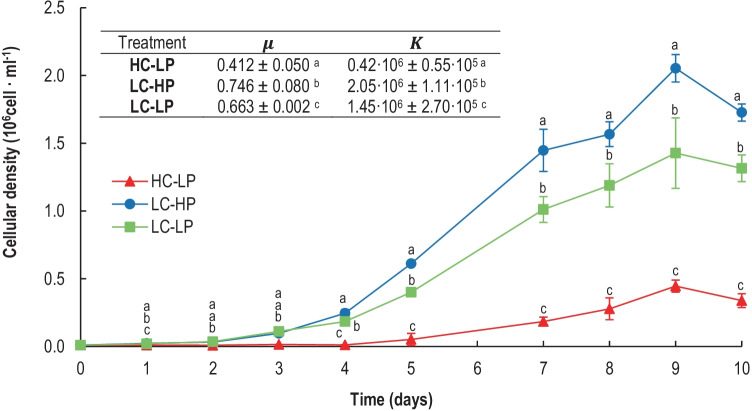
Fig. 2.
Cellular abundance (106 cell mL−1), net growth rates (µ, d−1), and loading capacity of the culture (K, 106 cell mL−1) of E. huxleyi cultures calculated with the logistic model of growth under HC-LP (1000–1200 µatm and pH 7.6–7.8), LC-HP (380–390 µatm and pH 8.1), and LC-LP (380–390 µatm and pH 7.6–7.8). Values are mean ± SD (n = 3). Significant differences between treatments are indicated by different letters for any given time (p < 0.05)

