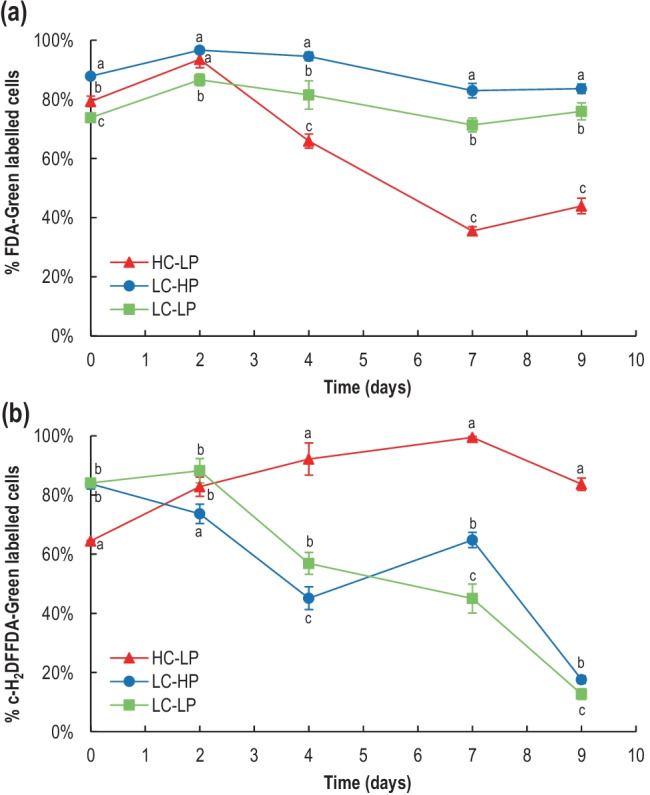
Fig. 3.

Variation of (a) cell viability measured as FDA-green fluorescence labelled E. huxleyi cells, and (b) reactive oxygen species (ROS) measured as c-H2DFFDA-green fluorescence labelled E. huxleyi cells in HC-LP (1000–1200 µatm and pH 7.6–7.8), LC-HP (380–390 µatm and pH 8.1), and LC-LP (380–390 µatm and pH 7.6–7.8). Values are mean ± SD (n = 3). Significant differences between treatments are indicated by different letters for any given time (p < 0.05)
