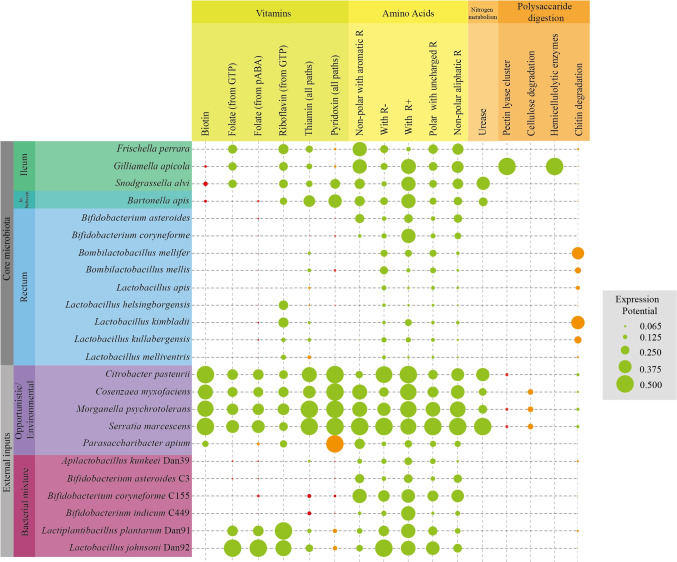
Fig. 5.
Functionality Dot Plot. The Dot-Plot represents the presumptive functionality of the microbial strains populating the microbiomes in this study, detected by NGS. Dot colours: Green represents complete metabolic clusters; orange represents incomplete metabolic clusters or complete presence in a strain and absence in other strains of the same species; red circle represents incomplete (nonfunctional) clusters but remarks the presence of some genes. If genes related to the cluster in the analysis are not detected, there are no circles reported. The circle sizes represent the number of genes detected, per metabolic category proportioned for every cluster

