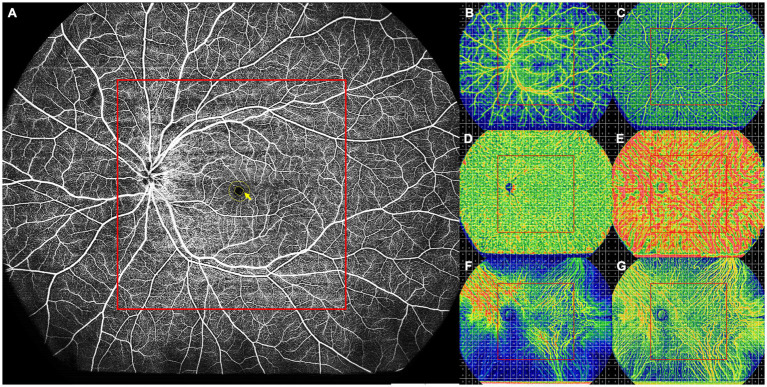
Figure 1.
Schematic diagram of a healthy control participant. (A) Full retinal layer. All FAZ parameters, including the FAZ area, perimeter, AI, and FD-300, were measured on the retinal slab from the ILM to 6 μm below the outer plexiform layer. The FD-300 refers to the flow density in a 300-μm annulus around the FAZ (yellow arrow). (B–G) The 24 × 20 mm UWF-SS-OCTA scans of each retinal and choroidal layer were divided into 24 × 20 grids of 1 × 1 mm, and each retinal and choroidal parameter was measured in the 1 × 1 mm grid. The centered 12 × 12 grids were defined as the central area (red box), while other grids as the peripheral area. (B) SCP, showing VFD. (C) DCP, showing VFD. (D) CC, showing VFD. (E) LMCV, showing VFD. (F) LMCV, showing CVV. (G) LMCV, showing CVI. AI, acicularity index; CC, choriocapillaris; CVI, choroidal vascularity index; CVV, choroidal vascularity volume; DCP, deep capillary plexus; FAZ, foveal avascular zone; FD-300, flow density in a 300-μm annulus around the FAZ; ILM, inner limiting membrane; LMCV, large and medium choroidal vessels; SCP, superficial capillary plexus; UWF-SS-OCTA, ultra-wide-field swept-source optical coherence tomography angiography; VFD, vessel flow density.

