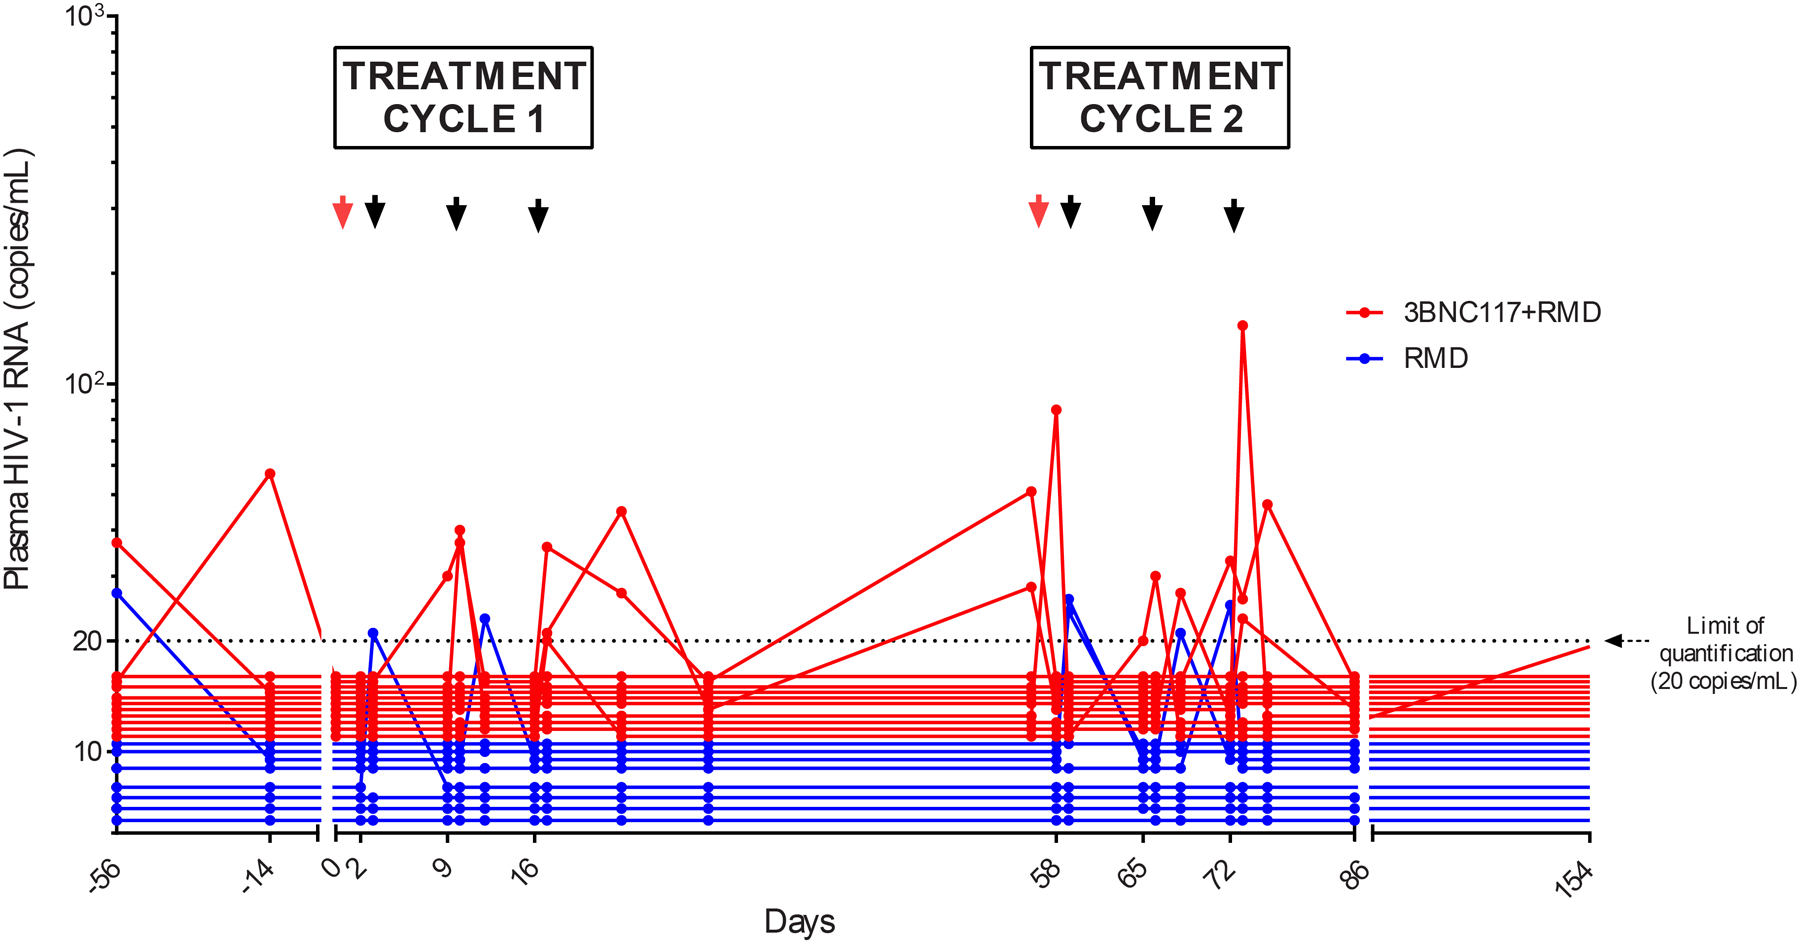
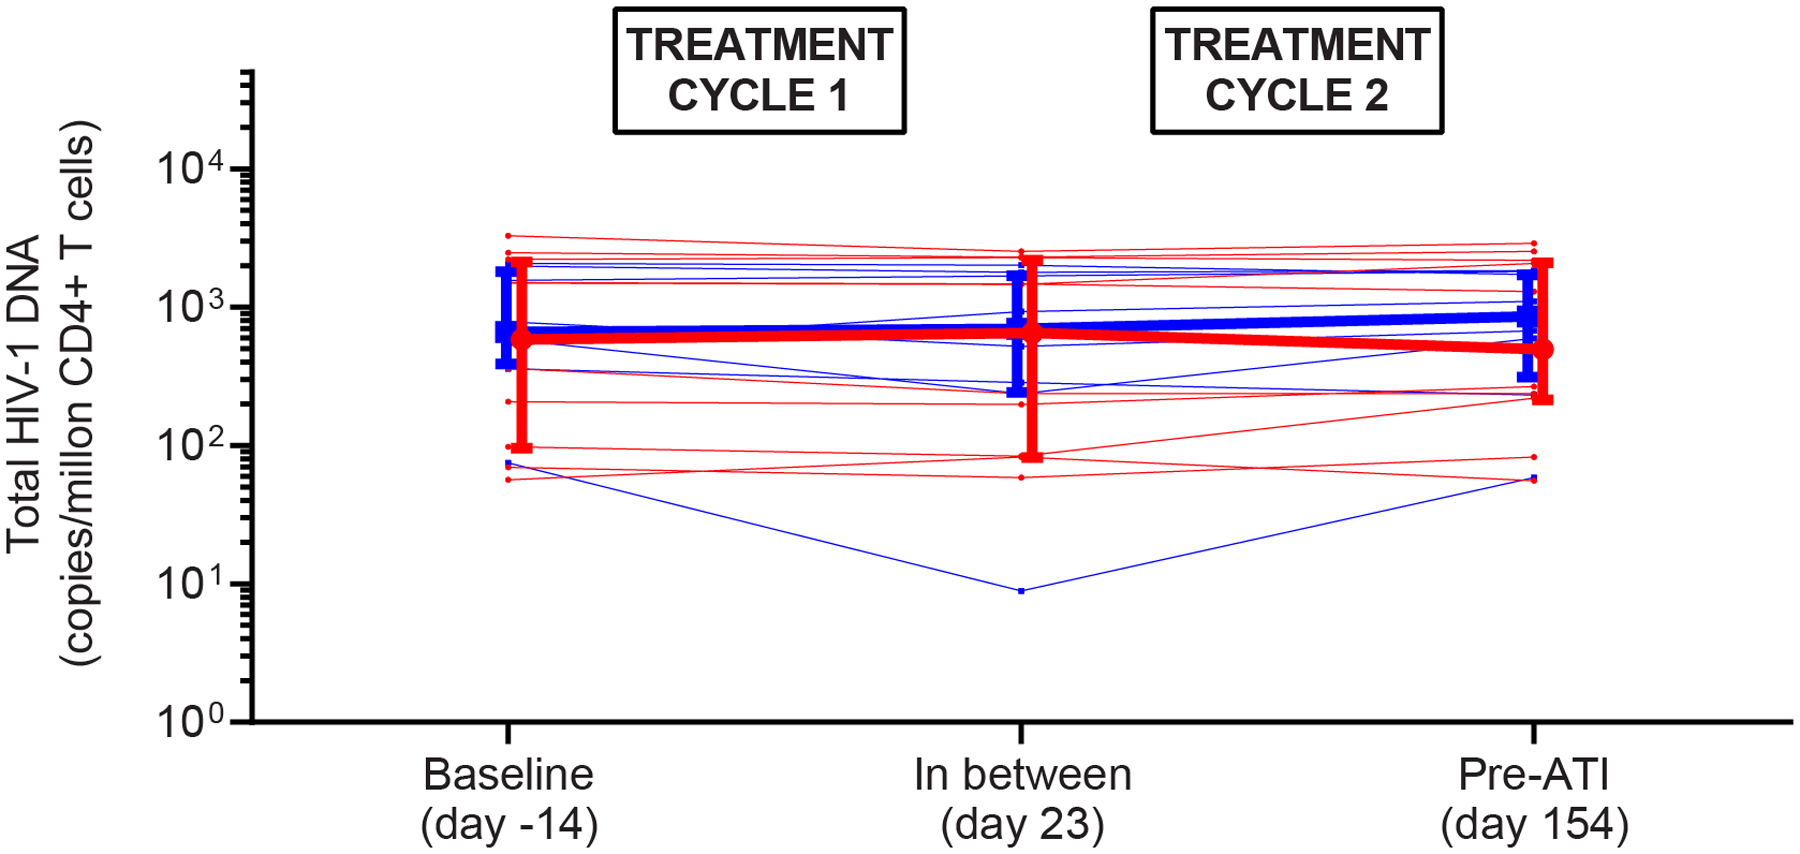
Figure 2.


HIV-1 transcription, plasma HIV-1 RNA, total HIV-1 DNA, and intact proviruses. (A) Mean (SEM) fold increase in the level of cell-associated unspliced HIV-1 RNA from baseline (prior to first romidepsin infusion) to subsequent time points in each of the two treatment cycles. (B) Individual plasma HIV-1 RNA. The dotted line represents the limit of quantification (20 copies per mL). The arrows represent infusion time points. (C) Individual and median (IQR) level of total HIV-1 DNA per million CD4 T cells. (D) Individual and median (IQR) level of intact proviruses per million CD4 T cells. Two individuals in group B had 0 intact proviruses per million CD4 T cells at baseline. RMD=romidepsin. * P < 0·05.
