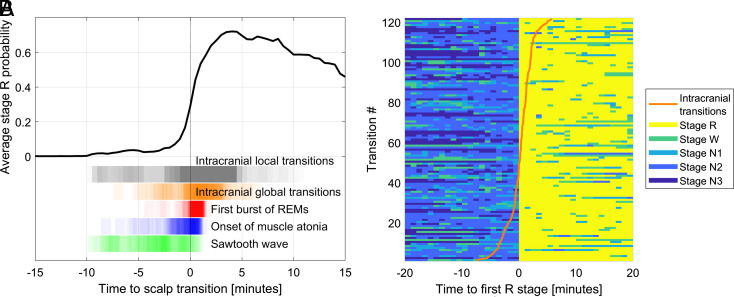
Fig. 1.
Time course of NREM-to-REM transitions. (A) Time course of the intracranially scored stage R probability during transitions to REM sleep relative to the manually scored transition on PSG with scalp EEG. The black curve represents the average R-stage probability as a function of time in all (n = 2,837) transitions, with t = 0 being the onset of the first manually marked R epoch. Note that this curve shows a gradual increase before t = 0 and does not reach 1, as it is based on intracranial sleep scorings which exhibit transitions at various times and where transitions are calculated as probabilities of stage R. At the bottom of the figure, vertical black lines represent individual transitions as derived from each intracerebral channel, and vertical orange lines indicate the time of the global intracranial transitions averaging the channels of the corresponding patient after discounting the effect of the brain region. Vertical red lines represent the first burst of REMs, vertical blue lines the muscle atonia onset, and vertical green lines the first sawtooth wave burst. Note the overlap between these EOG/EMG/scalp EEG markers and some local intracranially scored NREM to REM transitions, several minutes before the scalp transition. (B) Time course of the 30-s epoch staging as a function of time in the 120 NREM to REM sleep transitions. The color indicates the manually scored scalp stages. The orange line shows, for each scalp transition, the timing of its associated global intracranial NREM to REM sleep transition. The global transitions are determined from all analyzed intracranial channels of the corresponding patient, discounting the effect of the relative delay of the different brain regions. The transitions have been ordered based on the time of the global intracranial transitions.

