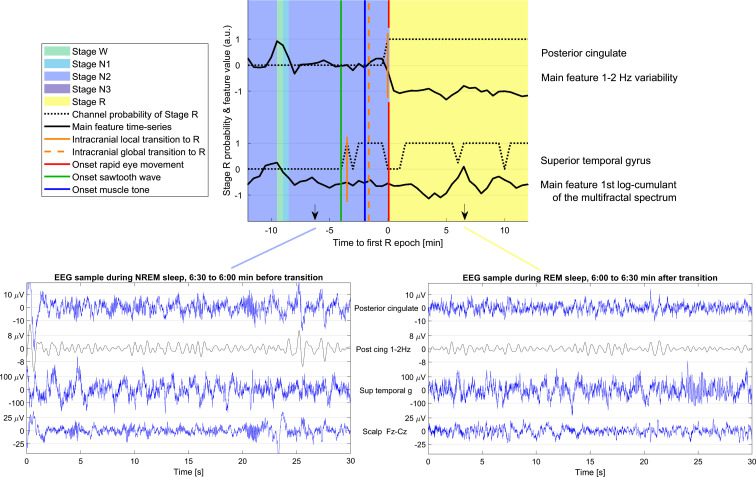
Fig. 3.
Example of a transition between NREM and REM sleep and typical intracranial EEG in NREM and REM. (Top) Transition between NREM and REM sleep in patient 14, showing two channels in different brain regions. The background color indicates the sleep stage as scored by human experts. The black curves show the variation in time of the most important feature for determining the transition time in the corresponding brain region. The dotted black lines show the probability of NREM for each of the channels as a function of time. The first epoch with stage R in each intracerebral channel is indicated with a short vertical orange line, while the broken vertical orange line indicates the global transition time as derived from all the intracerebral channels used in this patient. Note that the transition in the channel is determined on several features, and the threshold for determining stage R depends on the values of the features during baseline NR and R sleep. In this case, changes are not visually observed in the main feature of the superior temporal gyrus. The vertical green line indicates the onset of the first sawtooth waves, the vertical blue line the onset of muscle tone decrease, and the vertical red line the onset of the first rapid eye movements, all marked by human experts. In this example, the transition in the posterior cingulate is a clear transition (high clarity), and the transition in the superior temporal gyrus is not clear (low clarity). (Bottom) Examples of the scalp EEG (Fz-Cz) and SEEG signals in one sleep epoch before and after the transition are shown on the bottom left and right respectively. The same channels as in the top panel are shown. The blue traces correspond to the broadband signals and the black trace to the particular band associated with the most important feature in each brain region (variability in the 1 to 2 Hz band activity in the posterior cingulate, first log-cumulant of the multifractal spectrum in the superior temporal gyrus, which in practice is highly correlated to the overall amplitude; thus in the latter case, the main feature corresponds to the raw blue signal). The amplitude scale is different to better show the signals in different channels, but it is the same in the NREM and REM epochs to facilitate the comparison.

