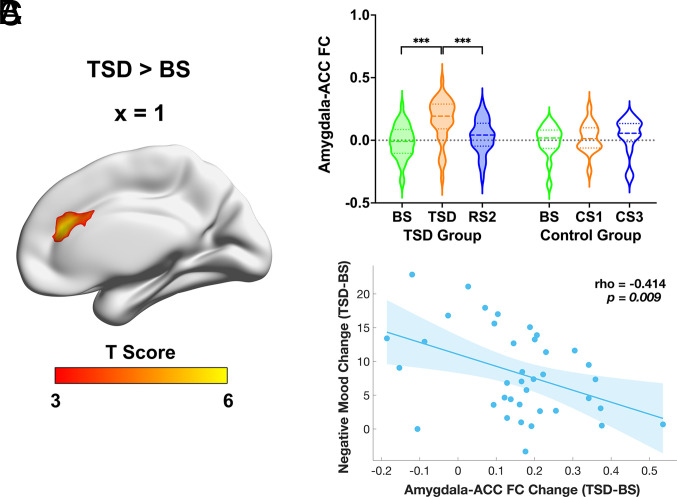
Fig. 2.
(A) Increased FC of the amygdala with ACC following TSD relative to BS in the healthy TSD group. Paired t tests were performed to examine the differences in FC of amygdala with all other voxels in the brain between BS and TSD, with age, gender, and head motion as covariates. The threshold was set at whole-brain FWE-corrected P < 0.001 at a cluster level, with cluster size larger than 30 voxels. (B) FC between the amygdala and ACC increased significantly after TSD, while it decreased significantly after RS2 in the TSD group. There were no significant amygdala–ACC connectivity changes among corresponding days in the control group. The dashed lines represent the median values, and the dotted lines represent the quartiles. (C) The scatter plot shows a significant correlation between increased amygdala–ACC connectivity and reduced mood worsening from baseline to TSD while controlling for age, gender, head motion, and baseline negative mood (rho = −0.414, P < 0.01). FC: functional connectivity; ACC: anterior cingulate cortex; BS: baseline sleep; TSD: total sleep deprivation; RS: recovery sleep; CS: control sleep; FWE: family-wise error. ***P < 0.001.

