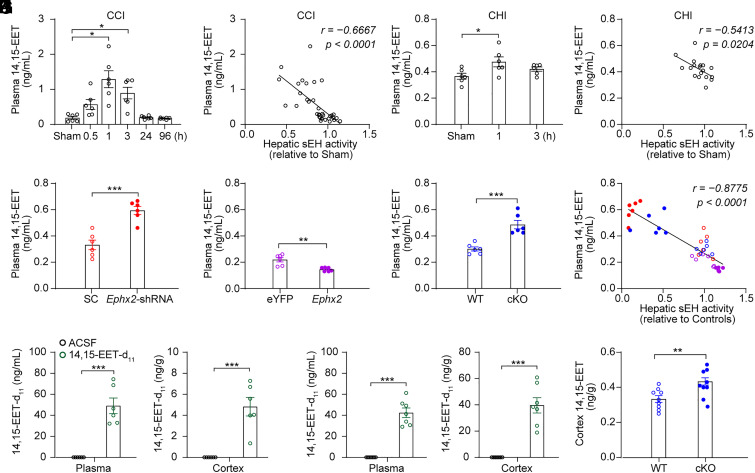
Fig. 4.
Hepatic sEH activity specifically modulated the plasma levels of 14,15-EET. (A) The plasma levels of 14,15-EET at different time points post-CCI in adult male C57BL/6J mice (n = 6 per time point). (B) Negative correlation was found between hepatic sEH activity and plasma 14,15-EET levels following CCI. (C) The plasma levels of 14,15-EET at different time points post-CHI in adult male C57BL/6J mice (n = 6 per time point). (D) Negative correlation was found between hepatic sEH activity and plasma 14,15-EET levels following CHI. (E–G) The plasma levels of 14,15-EET in mice following genetic manipulation of hepatic sEH and their control animals (n = 6). (H) Negative correlation between hepatic sEH activity and plasma 14,15-EET levels following genetic manipulations of hepatic sEH after CCI. (I) The plasma and cortex levels of 14,15-EET-d11 1 min after 14,15-EET-d11 injection in adult male C57BL/6J mice (n = 6). (J) The plasma and cortex levels of 14,15-EET-d11 1 min after 14,15-EET-d11 injection in CCI mice (n = 7). (K) The cortex levels of 14,15-EET at 4 d post-CCI in WT and cKO mice (n = 9). Statistical significance was determined using the Brown–Forsythe and Welch ANOVA followed by the Dunnett's T3 post-hoc test for A, one-way ANOVA with the Dunnett's post-hoc test for C; the Pearson’s correlation test for B, D, and H; or two-tailed unpaired Student’s t test for E–G and I–K. Data are presented as the means ± SEM. Asterisks indicate significant differences (*P < 0.05, **P< 0.01, ***P < 0.001).

