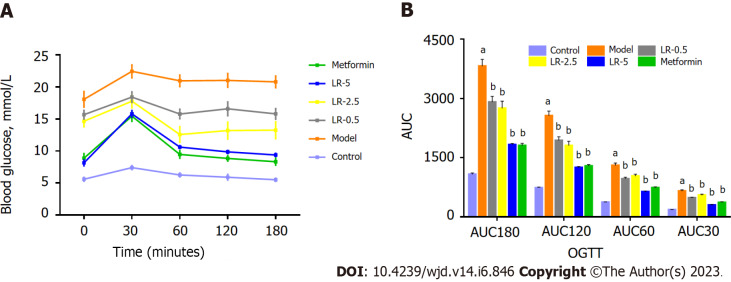
Figure 5.
Effects of Lomatogonium rotatum on the oral glucose tolerance test of diabetic rats. A: Changes in blood glucose from 0 to 180 min; B: Values for the area under the curve. The data represents means ± standard error of the mean (n = 10). aP < 0.05 vs the control group; bP < 0.05 vs the model group. AUC: Area under the curve; LR: Lomatogonium rotatum; OGTT: Oral glucose tolerance test.

