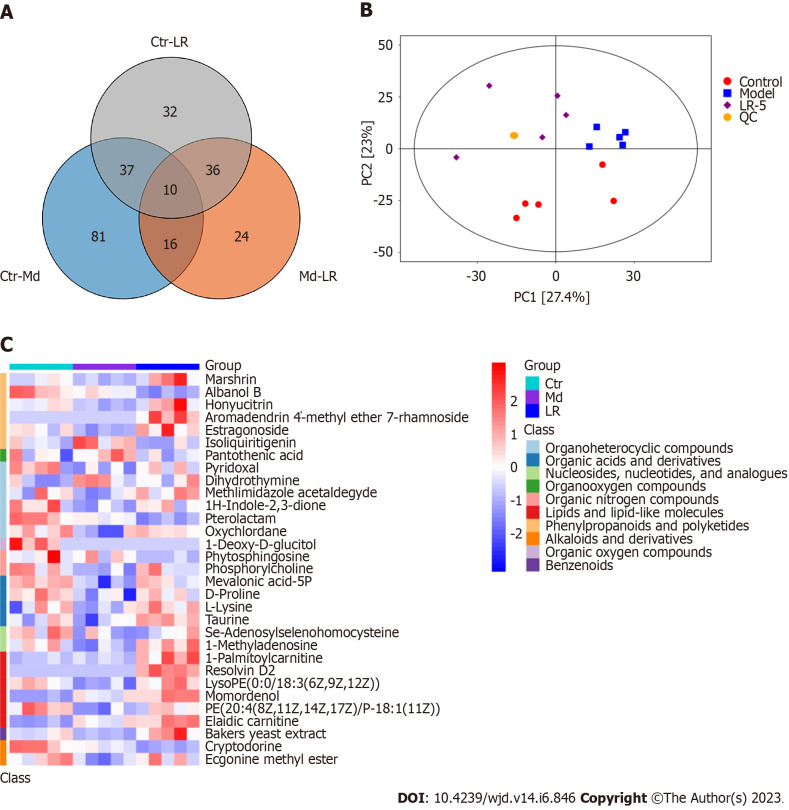
Figure 6.
Metabolomic analysis of Lomatogonium rotatum-treated streptozotocin-induced diabetic rats. A: The Venn diagram displays the amount of metabolites with differential expression. Different colors indicate distinct comparisons, whereas overlapping regions show differentially expressed metabolites shared by two groups; B: Serum metabolic characteristics of different groups were determined by a principal component analysis diagram; C: Cluster heat map of differentially-expressed metabolites in three experimental groups. In each sample, red and blue colors indicated higher and lower expression, respectively. LR: Lomatogonium rotatum; QC: Quality control.

