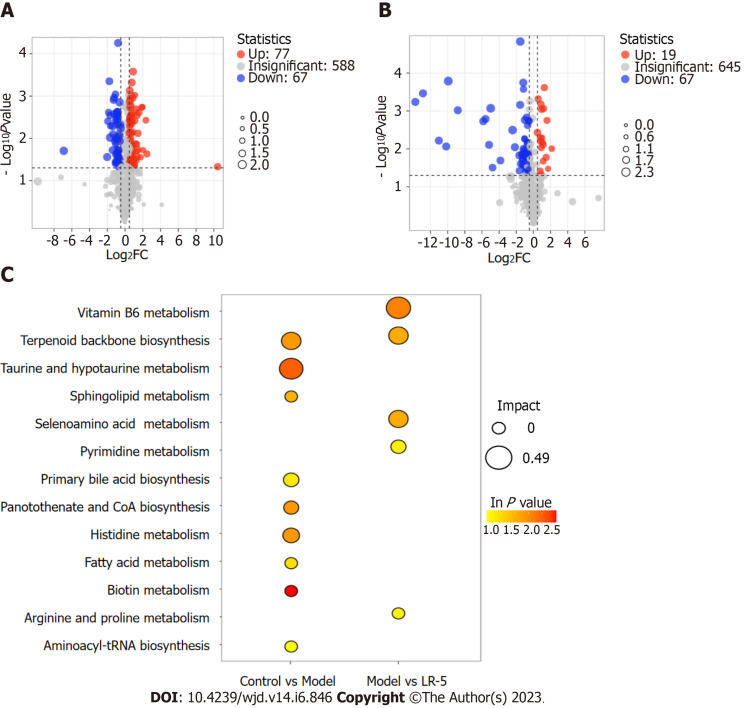
Figure 7.
Differential metabolites and pathways across groups. A and B: A volcano diagram illustrated the distinct metabolite compositions between control vs model (A) and model vs LR-5 (B). Green and red colors represent significant upregulation and downregulation of metabolites, respectively. Significant deferentially expressed metabolites were determined based on a P value < 0.05 and a log2fold-change of at least 2.0; C: XploreMET (Metabo-Profile) was used to evaluate the Kyoto Encyclopedia of Genes and Genomes metabolic pathways of the differential metabolites. FC: Fold change; LR: Lomatogonium rotatum; VIP: Variable importance in projection.

