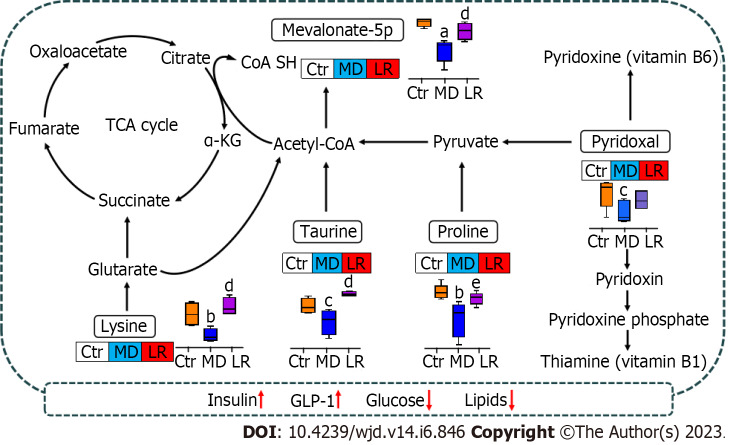
Figure 8.
Schematic summary of metabolic pathways related to the Lomatogonium rotatum effect on streptozotocin-induced diabetic rats. The relative levels of significantly altered metabolites were presented in different colors. The blue rectangle represents downregulation, the red rectangle represents upregulation, and the gray rectangle reveals no change in contrast to the control. aP < 0.001, bP < 0.01 and cP < 0.05 vs the control group; dP < 0.01 and eP < 0.05 vs the model group. Ctr: Control group; LR: Lomatogonium rotatum-treated group; MD: Model group; TCA: Tricarboxylic acid.

