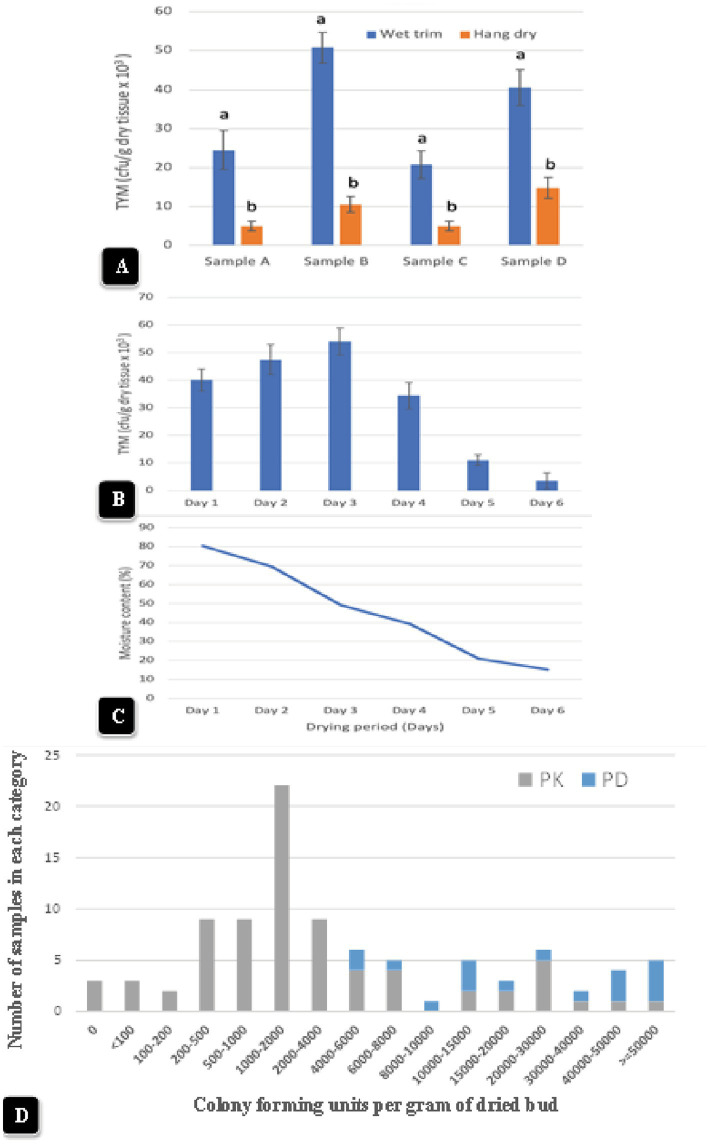
Figure 13.
(A) The impact of wet-trim versus hang-dry method dry on TYM in four representative samples of cannabis. In every sample, the TYM levels were significantly higher in the wet trim compared to the hang dry method. Error bars show 95% confidence intervals and vertical bars with different letters are significantly different from each other according to Tukey’s post-hoc test (p < 0.05). (B) Changes in TYM over a 6-day period in hang dry cannabis inflorescences. On each sampling day, 12 random samples were obtained from the drying room and assayed for TYM levels. There was a rapid decline in TYM between days 4 and 6. The experiment was conducted three times with similar results. Standard error bars show 95% confidence intervals. (C) Change in moisture content in hang-dry cannabis samples after 6 days of drying. On each sampling day, 12 random samples were obtained from the drying room and assayed for moisture content and water activity. The final moisture content was 13% (with a range from 11 to14% in repeated samples). (D) TYM levels in two cannabis genotypes over a 12-month period of sampling grouped according to the number of samples that belonged to each TYM category. The hang-dry method was used and analysis of TYM was conducted by a commercial laboratory. The TYM levels in 110 samples ranged from <100 to >50,000 cfu/g. Samples of “Powdered Donuts” contained more overall TYM compared to “Pink Kush”, especially in the >50,000 cfu/g category.

