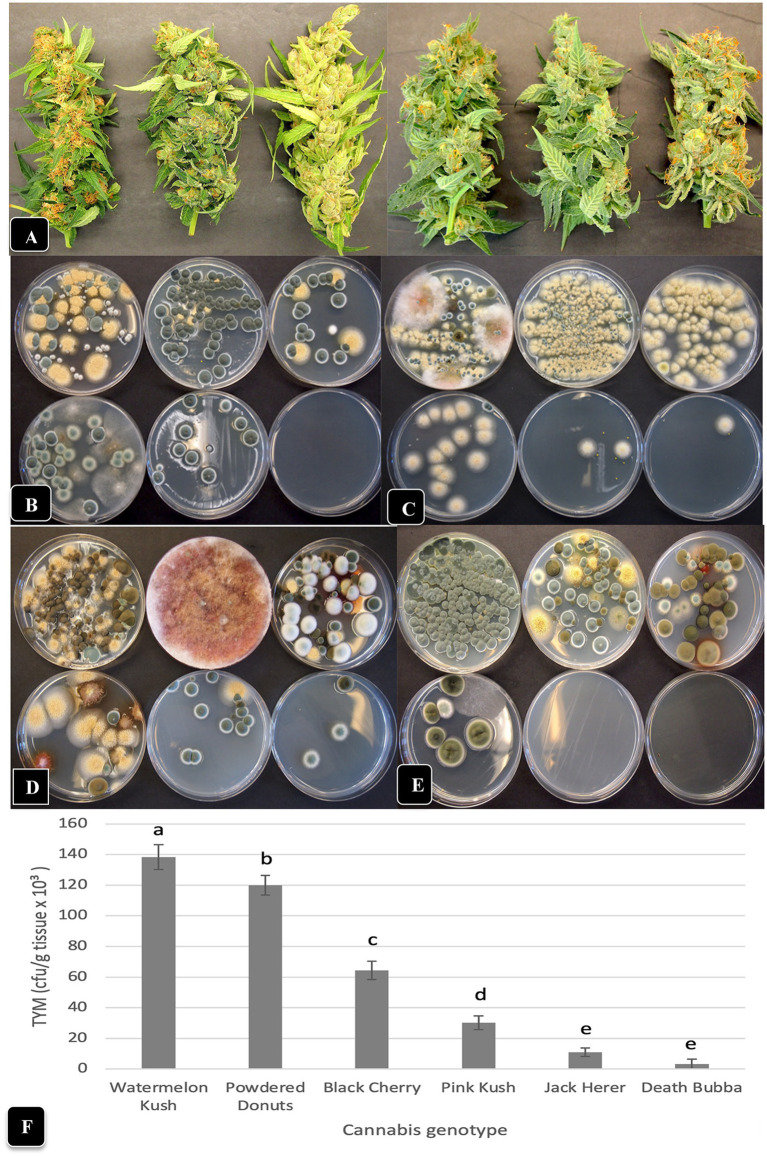
Figure 7.
Comparison of TYM in fresh cannabis inflorescences of six different genotypes grown under the same conditions and harvested over a 4-month period (June–September). (A) The appearance of inflorescence samples, going from left to right, are: “Watermelon Kush”, “Powdered Donuts”, “Black Cherry”, “Pink Kush”, “Jack Herer” and “Death Bubba”. (B–E) The number and diversity of colonies of TYM on Petri dishes that correspond to the above genotypes, when sampled in the months of (B) June, (C) July, (D) August and (E) September. The yellow colonies are Aspergillus ochraceus, the blue-green colonies are Penicillium spp., the dark brown colonies are Cladosporium cladosporiodes, and the pinkish-red colonies are Fusarium sporotrichiodes. Photos were taken after 5 days of incubation of Petri dishes at 23°C. Note the very low or complete absence of colonies from inflorescences of “Jack Herer” and “Death Bubba”. (F) Average TYM levels in inflorescences of six cannabis genotypes shown in (A). Data are the means from replicate dishes (n = 16) from the 4 months of sampling. Error bars show 95% confidence intervals and vertical bars with different letters are significantly different from each other according to Tukey’s post-hoc test (p < 0.05).

