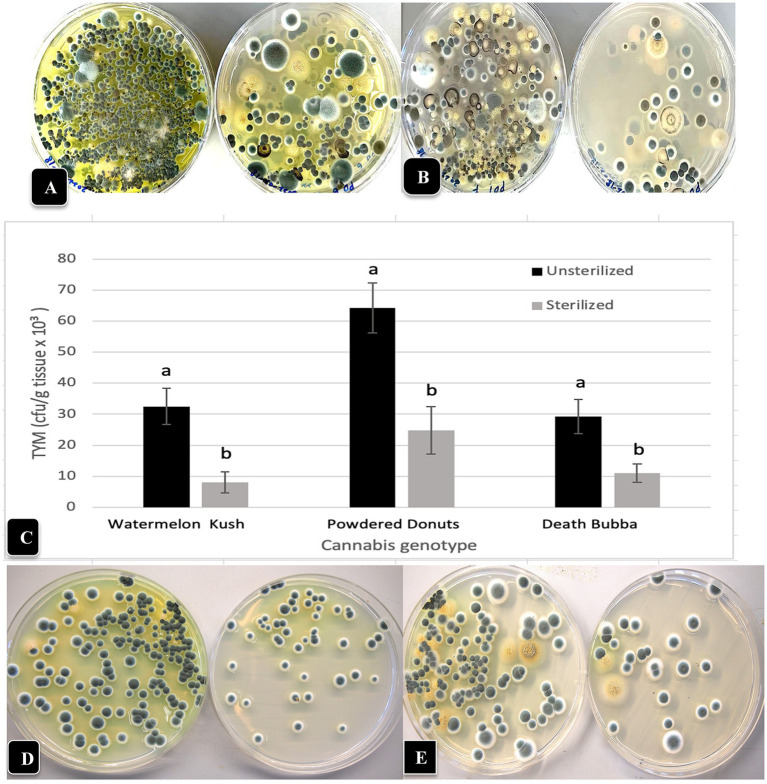
Figure 9.
The TYM levels present in inflorescence flower tissues and inflorescence leaves following dissection of the inflorescence to remove the inflorescence leaves in two cannabis genotypes. (A) Colonies on PDA + S originating from “Watermelon Kush” inflorescences (left dish) compared to inflorescence leaves (right dish) shows a much higher level of TYM in the flower tissues but inflorescence leaves still contain a significant level of TYM. (B) Same as (A) but the genotype is “Powdered Donuts” showing the same trend. (C) The effect of surface-sterilization using a combination of bleach and ethanol on TYM in cannabis inflorescence leaves from 3 genotypes. Data are the means from replicates (n = 20). Error bars show 95% confidence intervals and vertical bars with different letters are significantly different from each other according to Tukey’s post-hoc test (p < 0.05). (D,E) Comparison of levels of TYM in inflorescence leaves of 2 cannabis genotypes without surface-sterilization (left Petri dish) and following sterilization (right Petri dish). (D) Genotype “Watermelon Kush”. (E) Genotype “Powdered Donuts”.

