
Fig. 1 |. The immune landscape of tumours from patients with mCRPC prior to checkpoint therapy.
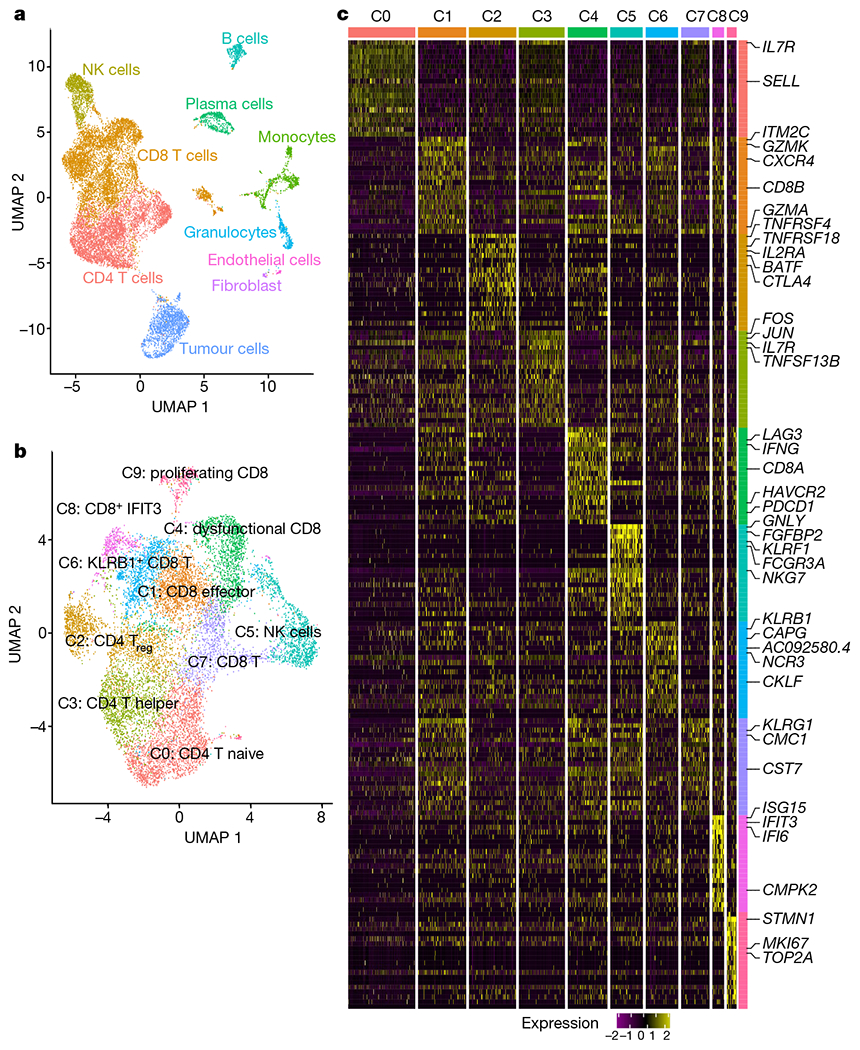
a, Uniform manifold approximation and projection (UMAP) of all cells that passed quality control (n = 16,044 cells). Cells are coloured on the basis of cell type. b, UMAP of all T and NK cells collected in this study with cells coloured by cell type (n = 12,073 cells). c, Heat map showing scaled expression of the top 20 cell markers ranked by fold change in each cluster in b. Colours represent cell types as in b. A list of representative genes is shown on the right.