
Extended Data Fig. 1 |. Clinical trial scheme of patients enrolled and details on biopsy location and genomics.
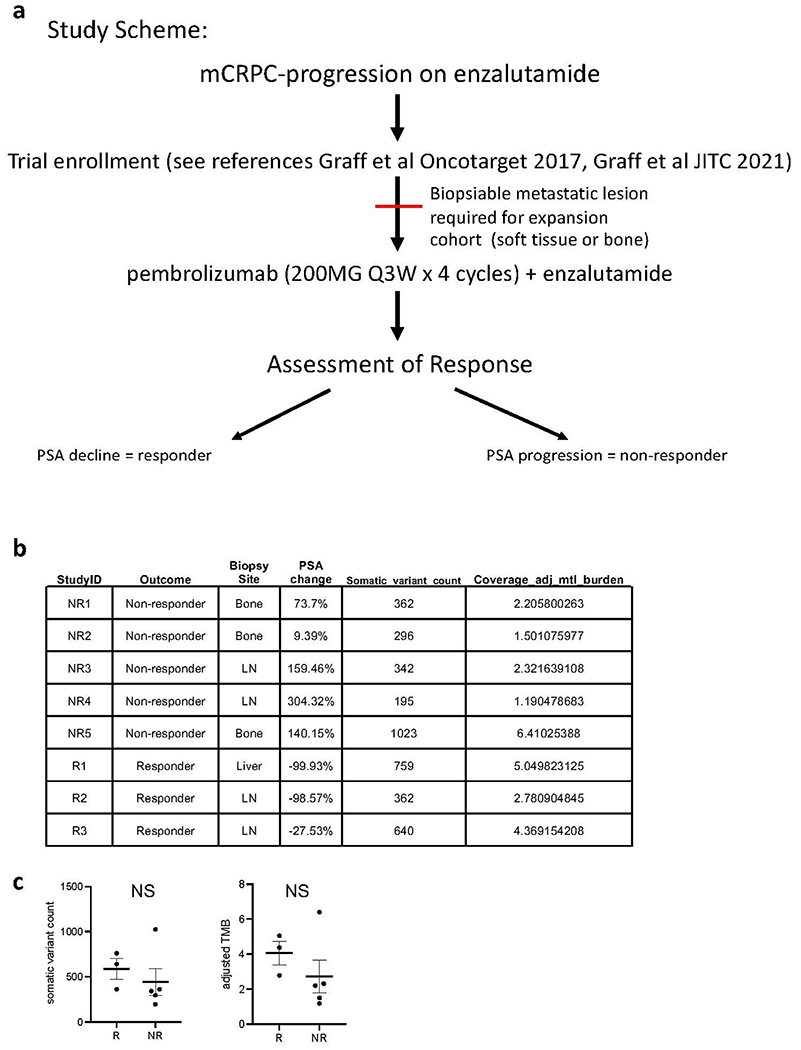
a. Clinical trial study scheme. b. Per-patient tumor mutations are shown in a table with each row representing an individual participant on study, and each column representing the unique participant identifier (StudyID), the participant’s response to study treatment (Outcome), the site of biopsied tissue specimen analyzed (Biopsy Site), the relative (%) change in PSA with treatment (PSA change), the number of somatic variants detected in that tumor specimen (Somatic_variant_count), and the coverage-adjusted tumor mutational burden defined as the Somatic_variant_count / #Mbp genome covered by ≥ 6 reads (Coverage_adj_mtl_burden). c. Comparison of the somatic variant counts (left) or coverage-adjusted tumor mutational burdens (right) for study responders (R, n = 3 patients) versus non-responders (NR, n = 5 patients); NS represents no significant difference detected by two-tailed Student’s t-test; mean values are depicted as bold horizontal lines. Error bars represent S.E.M.