
Extended Data Fig. 2 |. CD8 T cell subset associated with response to checkpoint therapy in mCRPC patients.
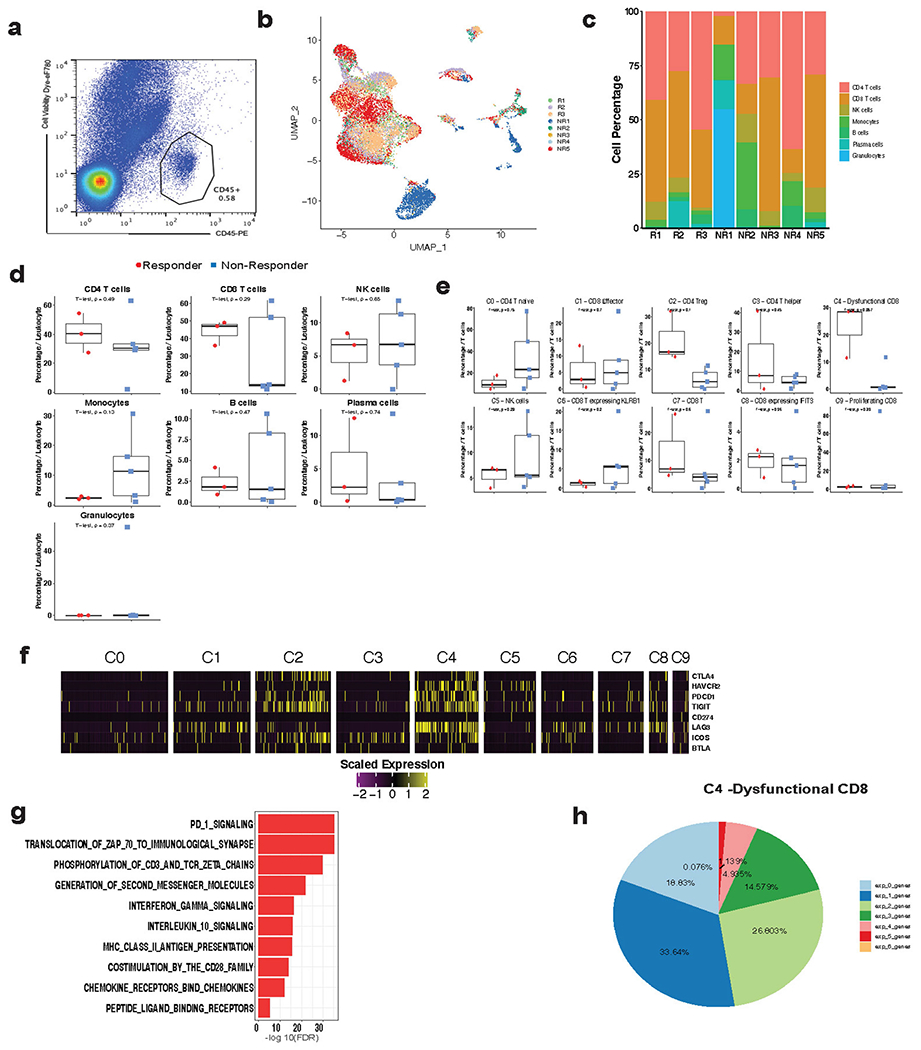
a, Representative flow cytogram for sorting tumor-associated leukocytes prior to scRNAseq. b, UMAP of all single cells (n = 16,044 cells) in this study colored by patient. c, Stack bar graph showing the % of cells per sample for immune cell clusters across each patient biopsy. d, e, Box plots comparing the % of cells per sample for immune cell clusters between responders (n = 3 patients) and non-responders (n = 5 patients). Percentage was calculated out of all immune cells (d) or all T/NK cells (e). Two-tailed unpaired Student’s t-test. Box center line, median; box, the interquartile range (IQR, the range between the 25th and 75th percentile); whiskers, 1.58 times IQR. f, Heatmap showing the expression of CTLA4, HAVCR2, PDCD1, TIGIT, CD274, LAG3, ICOS, BTLA in various T cell clusters. g, Pathways enriched in dysfunctional CD8 T cells (C4 cluster). h, Percentage of cells co-expressing a combination of PDCD1, LAG3, HAVCR2, CTLA4, TNFRSF4, and TIGIT in dysfunctional CD8 T cells (C4 cluster).