
Extended Data Fig. 5 |. Survival data following orthotopic PPSM implantation and enzalutamide + anti-PD-L1 treatment.
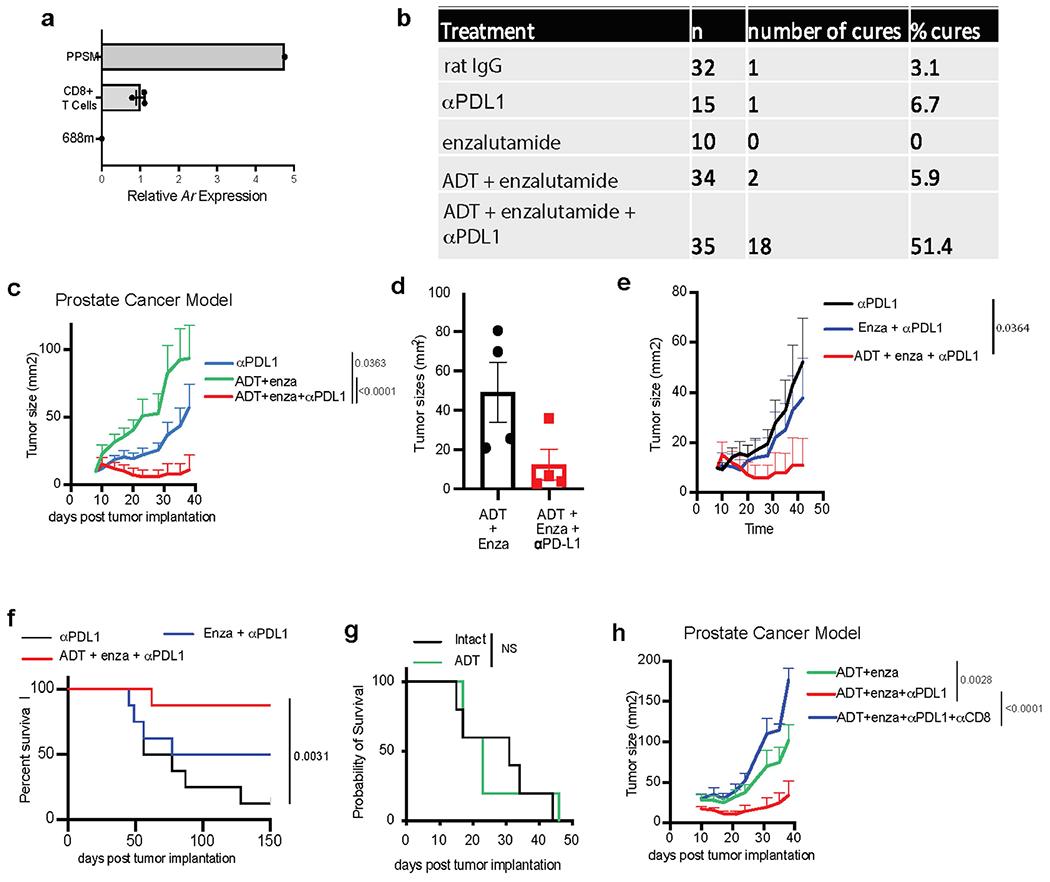
a, Ar expression by qPCR in mouse CD8 T cells, as compared with PPSM and 688m AR positive and negative control cell lines, respectively. Data combined from 3 independent experiments. b, Summary table of the experiments described in Fig. 3a. c, Average tumor growth of PPSM tumor bearing animals treated with different treatment combination as described in Fig. 3a. Data combined from 4 independent experiments, 8 to 10 animals per group. d, 12–14 wk old male mice were orchiectomized and PPSM tumor cells were injected orthotopically in the anterior lobe of the prostate. One week later, animals were treated with enzalutamide or enzalutamide + anti-PD-L1 (5 animals per group). 4 weeks post tumor inoculation, tumors were collected and measured. e–f, PPSM tumor bearing animals were treated along the same timeline as Fig. 3a but in the absence of ADT. Average tumor growth (e) and survival curves (f) of tumor bearing animals treated with combination therapy in the presence or absence of ADT (data depict one representative experiment of two experiments, 8 animals per group). g, Survival curves of PPSM tumor bearing animals orchiectomized or not at day 7 (5 animals per group). h, Average tumor growth of PPSM tumor bearing animals treated with combination therapy and α-CD8 depleting antibody (data depict one representative experiment of two experiments, 10 animals per group). Error bars represent S.E.M. Two-way ANOVA was used for c, e and h, and log-rank (Mantel-Cox) was used for f and g.