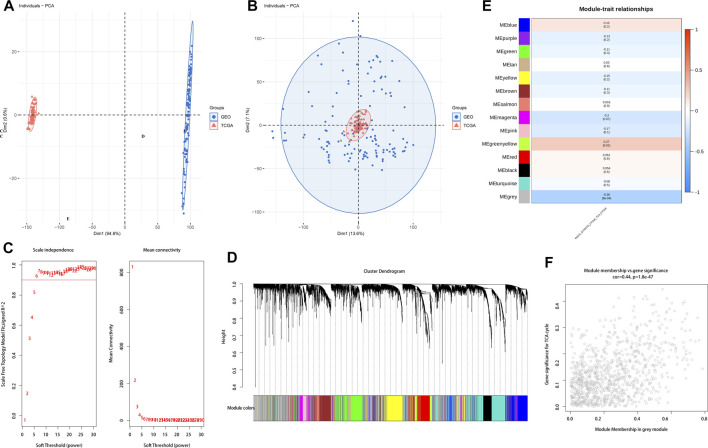
FIGURE 2.
Distribution of TCA cycle-related genes. (A). PCA of the TCGA and GEO datasets before batch processing. (B) PCA of the TCGA and GEO datasets after batch processing. (C) Network topology analysis of different soft threshold powers. (D) Hierarchical clustering dendrogram of co-expressed genes identified by ESCC modules. (E) Module feature genes associated with TCA cycle-related module in ESCC. (F) Enrichment of TCA cycle-related DEGs for grey modules.

