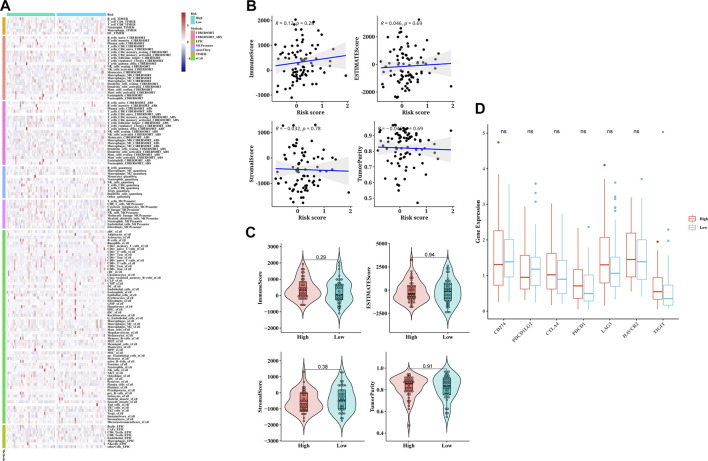
FIGURE 5.
Correlation of TCA cycle-based risk score with immune cell infiltration and immune checkpoint expression in ESCC patients. (A) Correlation plots of 22 tumor-infiltrating immune cells (TICs) in different patients was mapped by the seven algorithms. (B) Scatter plots of linear correlation between tumor purity and TCA cycle risk score. (C) Violin plots showing the distribution of immune score, ESTIMATE score, Stromal scores, and tumor purity in the TCA cycle high-risk and low-risk groups. (D) Box plot showing the difference in the expression of immune checkpoint genes between the two risk groups.

