FIGURE 7.
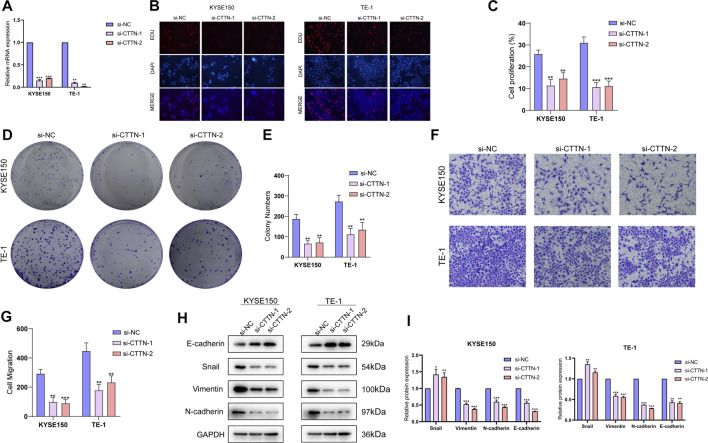
Functions of CTTN in the ESCC cells. (A) The relative expression levels of CTTN mRNA in KYSE150 and TE-1 cells transfected with si-NC, si-CTTN-1 and si-CTTN-2. (B) Representative fluorescence images showing EdU assays in the si-NC, si-CTTN-1 and si-CTTN-2 groups. (C) The proliferation rates in the groups. (D) Representative images of colonies formed by cells transfected with si-NC, si-CTTN-1 and si-CTTN-2. (E) Number of colonies in the groups. (F) Representative images of transwell assays showing invasion of cells transfected with si-NC, si-CTTN-1 and si-CTTN-2. (G) Proportion of invading cells in the groups. (H) Protein expression of E-cadherin, Snail, Vimentin and N-cadherin in the groups. (I) The quantification of protein levels.

