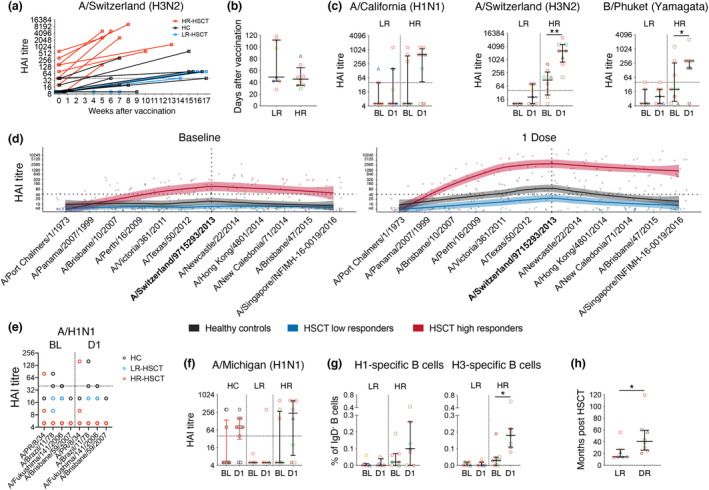
Figure 4.

A subgroup of HSCT recipients had superior humoral responses towards A/H3N2. (a) HAI titre against A/Switzerland (H3N2) versus weeks after vaccination. (b) Days post vaccination per LR and HR group. (c) HAI titre against three vaccine strains. (d) HAI antibody landscapes against 12 A/H3N2 strains. Vertical and horizontal dotted lines indicate the vaccine strain and seroprotective HAI titre at 40 respectively. Solid lines indicate titre landscapes across strains estimated using GAMs and shadings indicate 95% CI for the model. Colour dots show individual participant titres against each antigen. (e, f) HAI titre against four pre‐pandemic A/H1N1 strains and A/Michigan (H1N1) strains. (g) Frequency of influenza‐specific B cells against H1 and H3 (nHR‐HSCT = 7). (h) Time after transplantation for low and high responders of HSCT recipients. Bars indicate median and interquartile range. Symbols of HSCT recipients were the same as in Figure 1b. Technical replicates were not performed due to limited patient samples. Significance between baseline and after one dose was determined using the Wilcoxon test (nHC = 10, nLR‐HSCT = 7, nHR‐HSCT = 8; *P < 0.05, **P < 0.01).
