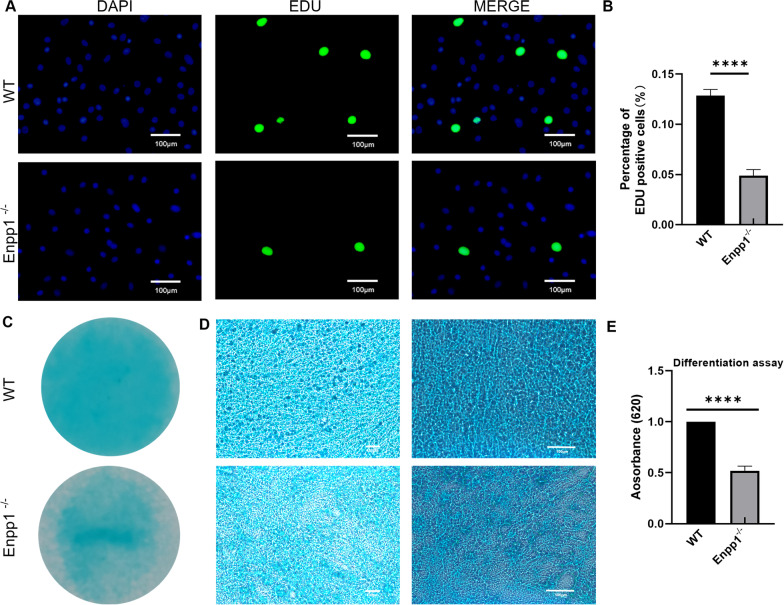
Fig. 2.
Enpp1 deletion impaired chondrocyte proliferation and chondrogenic differentiation: A EDU staining of WT and Enpp1−/− primary chondrocyte (EDU-positive chondrocyte, green; DAPI, blue; scale bar: 100 µm, n ≥ 3). B The quantification of EDU-positive chondrocyte (WT groups = 12.867% ± 0.603% and Enpp1−/− groups = 4.900% ± 0.600%, p < 0.0001, n ≥ 3). C Alcian blue staining of WT and Enpp1−/− chondrocyte micromasses induced by 10% FBS with ITS for 21 days. D Microscope images of WT and Enpp1−/− chondrocyte micromasses (left, 50 × , scale bar: 100 µm, n ≥ 3; right, 100 × , scale bar: 100 µm, n ≥ 3). E The quantitative analysis of Alcian blue staining by measuring the optical density of the micromasses extracted by guanidine-HCl from WT and Enpp1−/− groups. Enpp1, ectonucleotide pyrophosphatase/phosphodiesterase 1; EDU, 5-Ethynyl-2′-deoxyuridine; WT, wild type; DAPI, 4′,6-diamidino-2-phenylindole; FBS, fetal bovine serum; ITS, Insulin-Transferrin-Selenium

