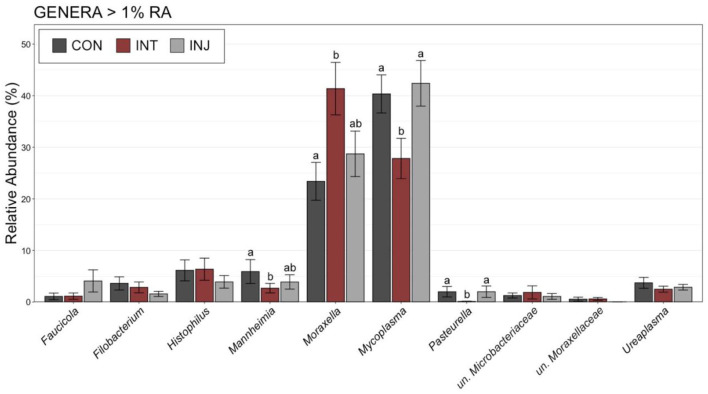
Figure 3.
Bar plot showing the relative abundances of the genera with >1% relative abundance of the microbial communities in nasopharyngeal samples collected from healthy cattle on d 28. Error bars display the standard error of the mean for each genus, and colors identify the different treatment groups. The 10 most abundant genera are displayed. Groups with different superscript letters have significantly different mean relative abundances (Pairwise Wilcoxon rank-sum with Benjamini-Hochberg correction, P < 0.05).

