Figure 5.
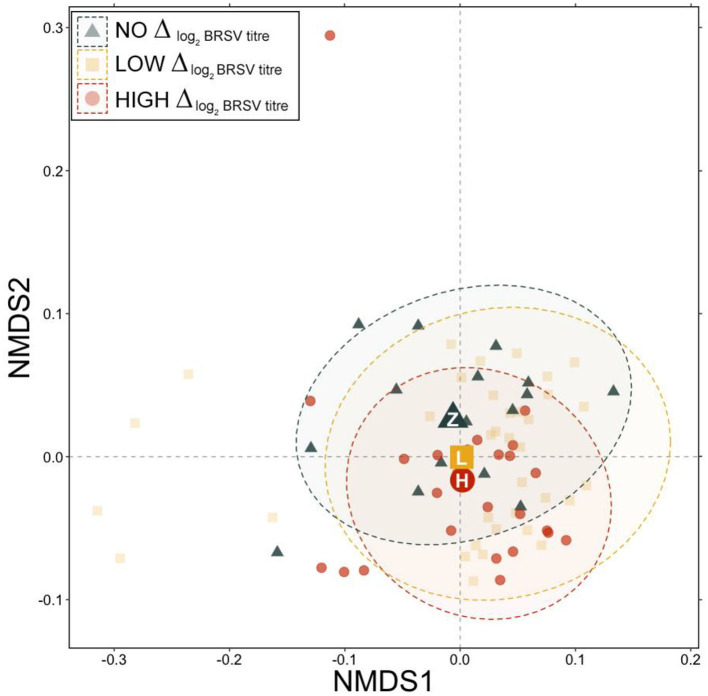
Non-metric multidimensional scaling (NMDS) of generalized UniFrac distances illustrating variation in microbial community structure associated with different BRSV antibody responses. The NMDS demonstrates clustering of 16S rRNA gene sequences from animals classified as having no response, low response, or high response at d 28. The large, opaque point represented the centroid of that group, with more transparent points representing individual samples. Dashed lines and shaded areas represent 95% confidence ellipses for each group.

