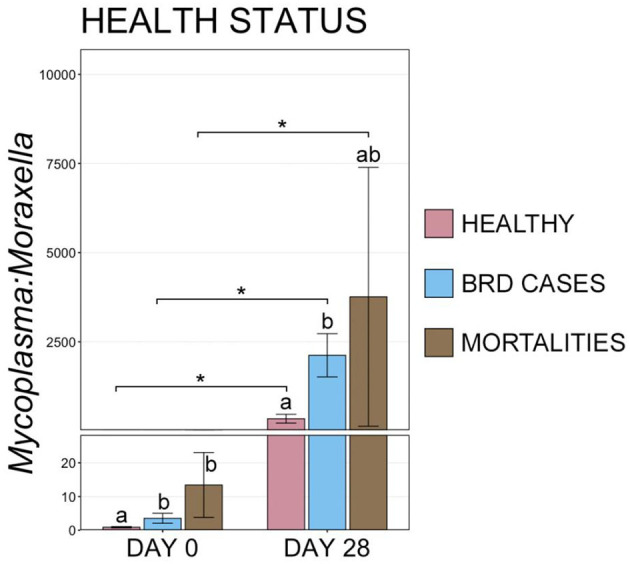
Figure 8.

Bar plot showing the ratio of relative abundances for Mycoplasma:Moraxella genera, by final health classification. Error bars display the standard error of the mean, and cattle with different health classifications are denoted by different colors. Significant differences in the M:M ratio at a single timepoint are identified by different superscript letters, and significant differences between timepoints are denoted with * (Pairwise Wilcoxon rank-sum with Benjamini-Hochberg correction, P < 0.05).
