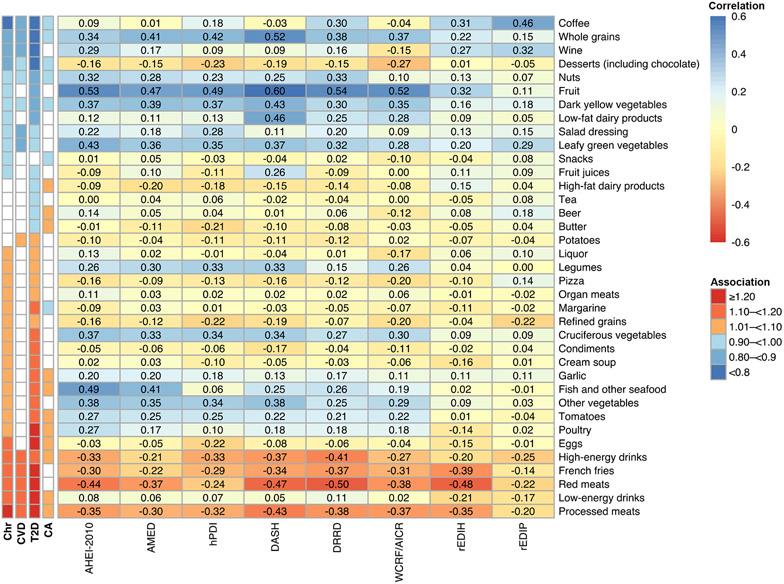
Fig.3.
Baseline Spearman correlations between energy-adjusted cumulative average dietary patterns and food groups in the pooled data of three cohorts (n = 205,852 participants). Spearman correlation coefficients are shown and highlighted in color. Food groups are ordered based on the hazard ratios of their associations with major chronic disease (Chr). The associations of food groups (comparing the 90th to 10th percentile) with major chronic disease (Chr), major cardiovascular disease (CVD), type 2 diabetes (T2D), or total cancer (CA) are indicated on the left of the figure. We reported unadjusted P values based on two-sided statistical tests. Significant associations (P<0.05) are highlighted in color according to the magnitude of hazard ratios. AHEI-2010, Alternative Healthy Eating Index-2010; AMED, Alternate Mediterranean Diet score; DASH, Dietary Approaches to Stop Hypertension score; DRRD, Diabetes Risk Reduction Diet; hPDI, Healthful plant-based diet index; rEDIH, reversed Empirical dietary index for hyperinsulinemia; rEDIP, reversed Empirical dietary inflammation pattern; WCRF/AICR, World Cancer Research Fund/American Institute for Cancer Research (WCRF/AICR) dietary score.

