An official website of the United States government
Here's how you know
Official websites use .gov
A
.gov website belongs to an official
government organization in the United States.
Secure .gov websites use HTTPS
A lock (
) or https:// means you've safely
connected to the .gov website. Share sensitive
information only on official, secure websites.
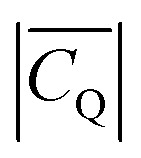
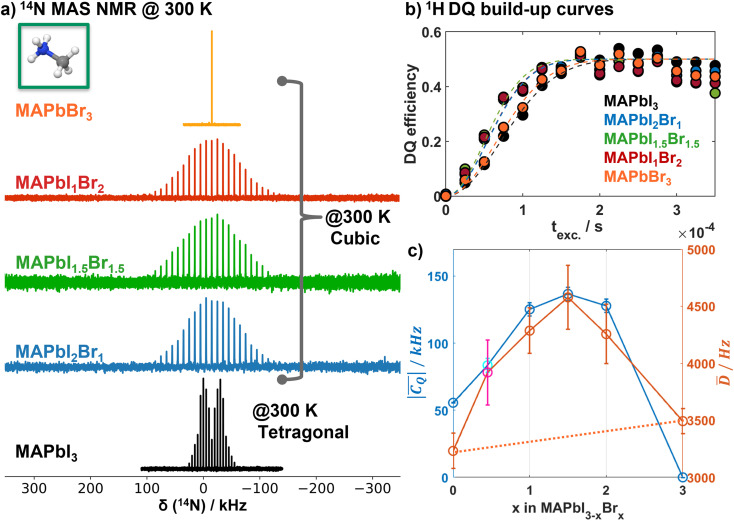
 (blue) and average dipolar coupling D̄ (orange) as a function of Br content x in MAPbI3−xBrx. The data points (cyan; magenta) at x = 0.45 corresponds to a double-mixed MA0.15FA0.85PbI2.55Br0.45 composition with additional MA/FA mixing on the A site, which was previously analyzed with respect to the 1H dipolar coupling,