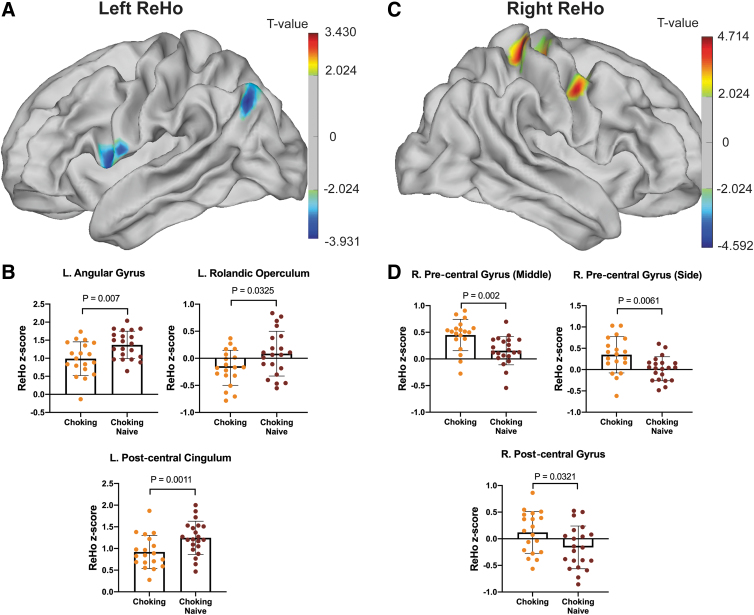
FIG. 3.
Regional differences in ReHo between groups. (A) ReHo levels in the left hemisphere showed group differences in three cortical regions (B) including the angular gyrus, Rolandic operculum, and post-central cingulum. (C) ReHo levels in the right hemisphere, in which two cortical regions showed group differences, such as the pre/post-central gyri (D). ReHo, regional homogeneity.

