
Figure 2. Knockout of Ptchd1 in mice enhances opioid efficacy and eliminates tolerance.
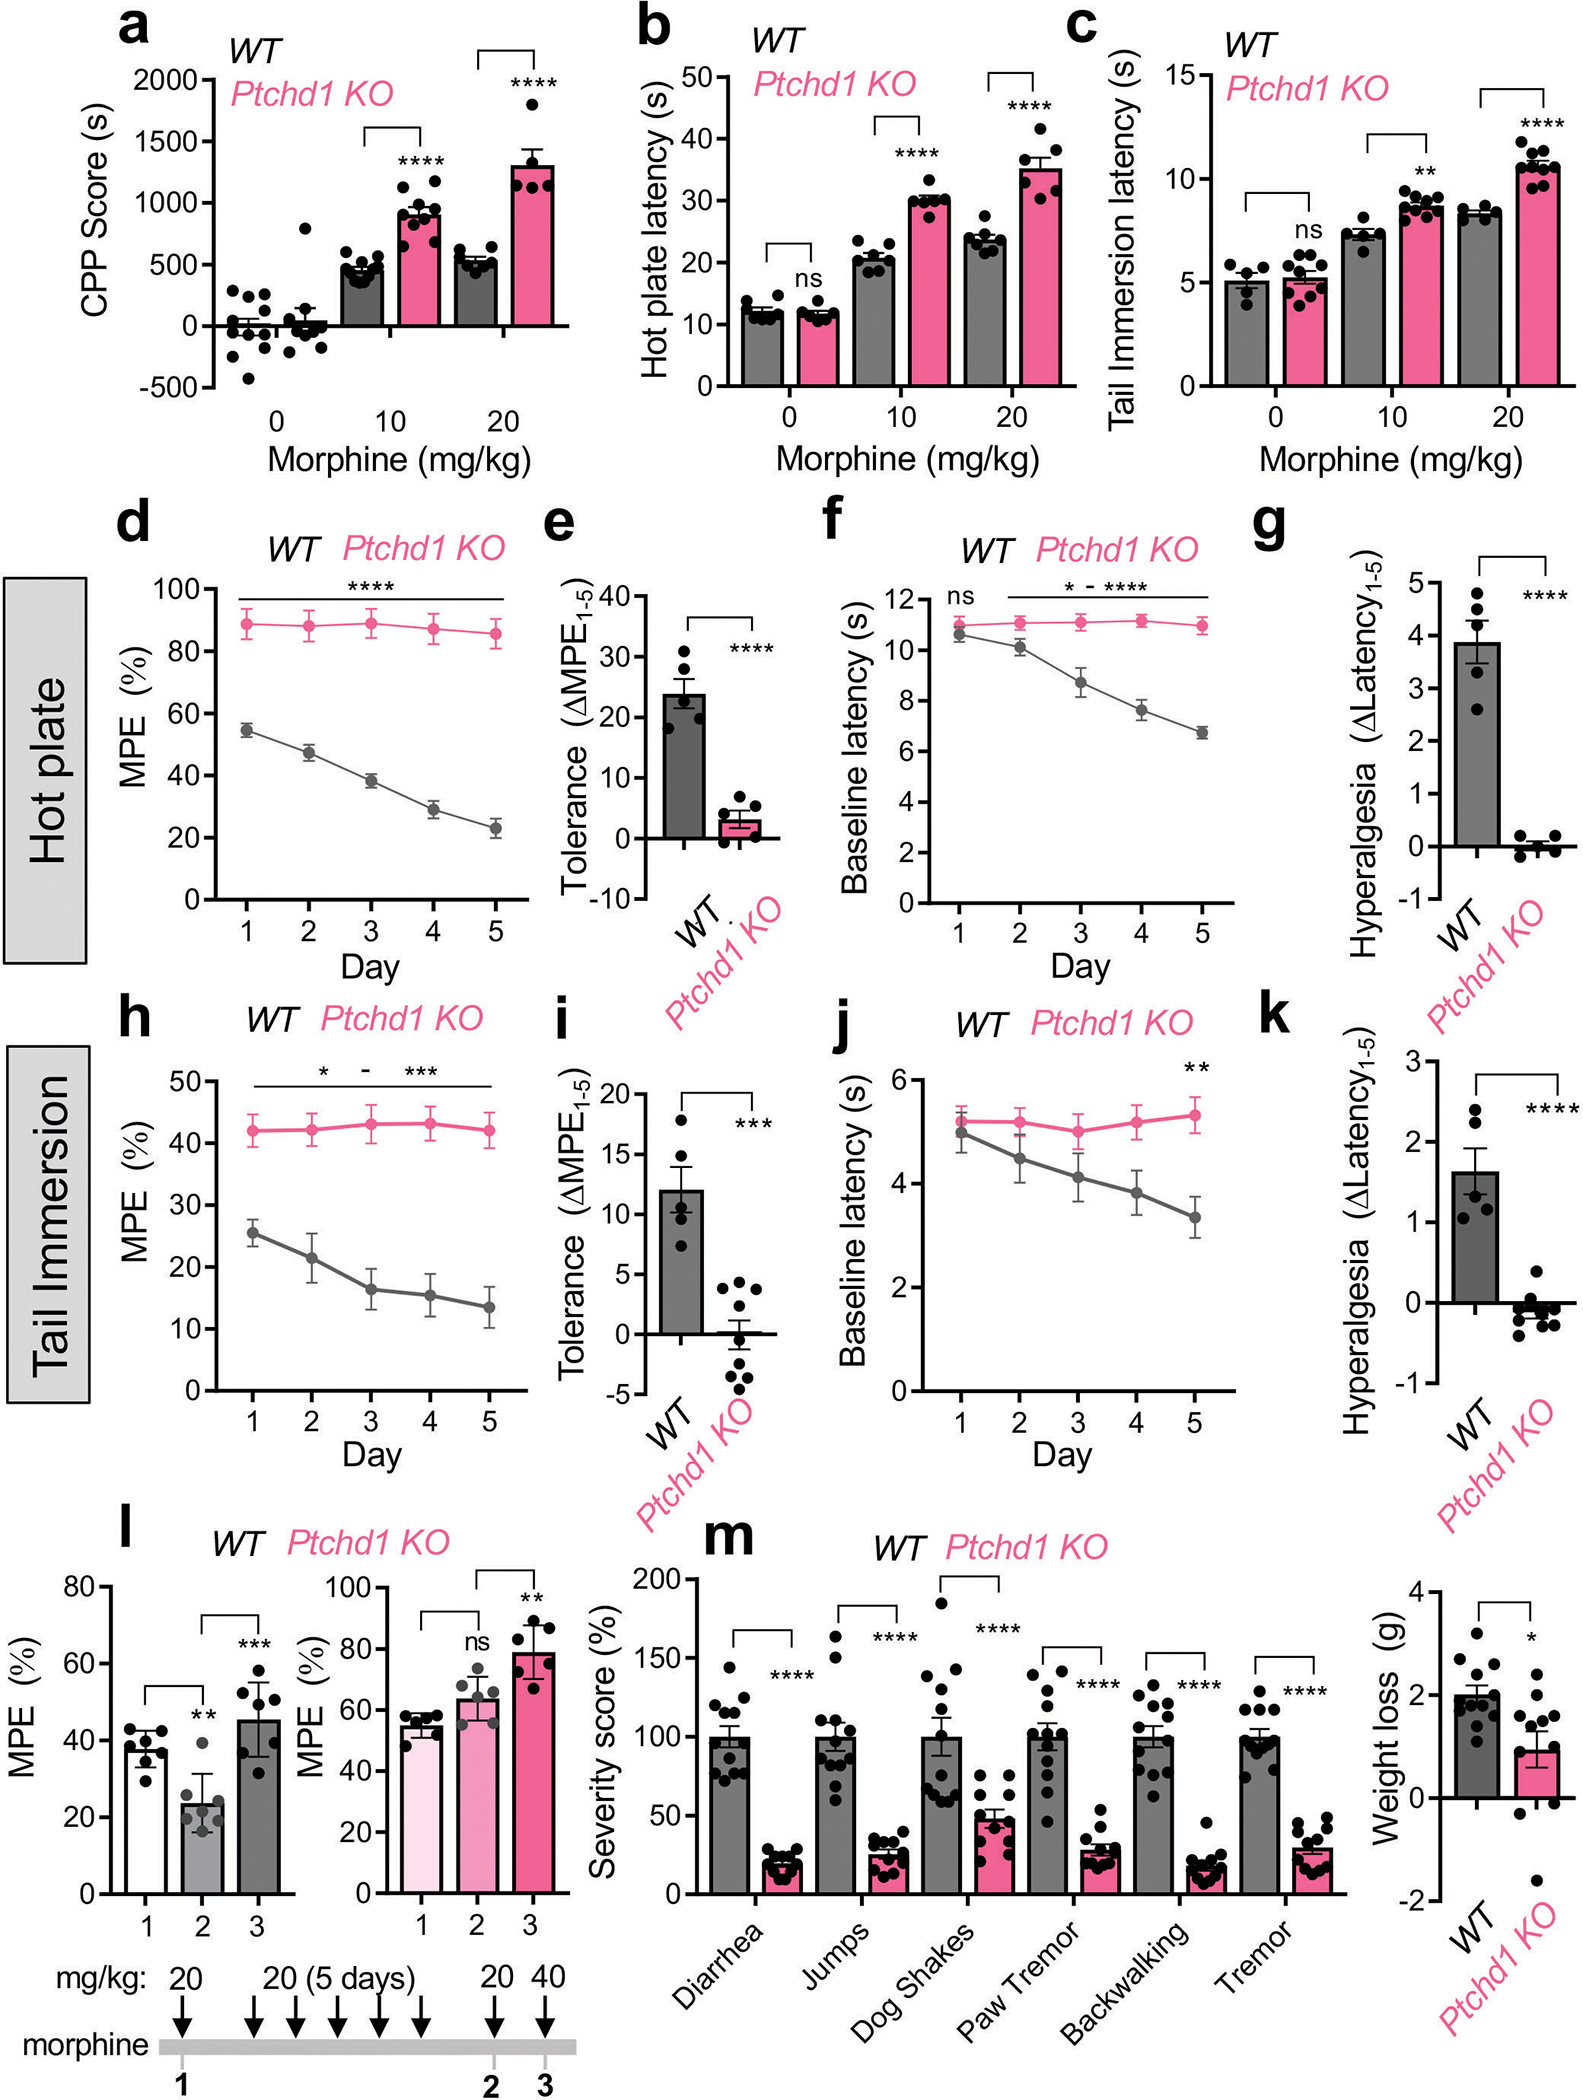
a, Evaluation of morphine reward by conditioned place preference test. For the 0 mg/kg and 10 mg/kg dose, n=11 animals per genotype; for the 20 mg/kg dose, n=7 WT and n=5 Ptchd1 KO mice. b, Evaluation of analgesia by hot plate assay. n=7 WT and n=6 Ptchd1 KO mice.
c, Evaluation of analgesia by tail immersion assay. n=5 WT and n=9 Ptchd1 KO mice.
d, Evaluation of analgesic tolerance by hot plate assay. n=5 male mice per genotype
e, Quantification of analgesic efficacy reduction as a difference in the MPE between session 1 and 5 from panel d.
f, Evaluation of opioid induced hyperalgesia by hot plate assay.
g, Quantification of opioid induced hyperalgesia as a difference in the baseline latencies between session 1 and 5 from panel f.
h, Evaluation of analgesic tolerance by tail immersion assay. n=5 WT and n=9 Ptchd1 KO mice.
i, Quantification of analgesic efficacy reduction as a difference in the MPE between session 1 and 5 from panel h.
j, Evaluation of opioid induced hyperalgesia by tail immersion assay. Baseline response latencies of mice receiving repeated morphine injections (in panel h).
k, Quantification of opioid induced hyperalgesia as a difference in the baseline latencies between session 1 and 5 from panel j.
l, Dose-response profile of analgesic tolerance. Mice were evaluated by tail immersion assay before and after repeated injections of morphine (20 mg/kg). n=7 WT and n=6 Ptchd1 KO mice.
m, Evaluation of somatic withdrawal following precipitated withdrawal from chronic morphine administration. n=12 WT and n=11 Ptchd1 KO mice.
For panels a, b, and c, statistical comparisons were performed by 2-way ANOVA and Šídák’s post hoc comparison. For panels d, f, h, and j the statistical comparisons were performed by 2-way ANOVA and Bonferroni’s post hoc comparison. For panels e, g, i, k, and m, statistical comparisons were performed by unpaired two tailed Student’s t-test. In panel l data was analyzed by one-way ANOVA with Tukey’s post hoc comparison. *p<0.05, **p<0.01, ***p<0.001, ****p<0.0001. Mean values with S.E.M. errors are shown.