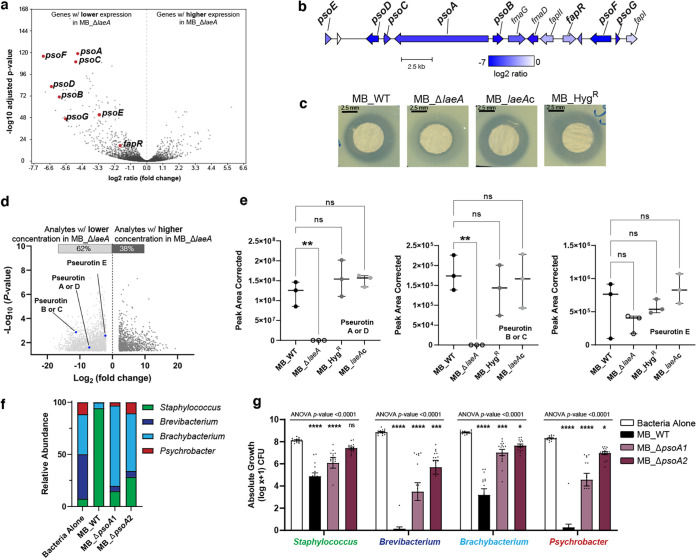
FIG 4.
Deletion of laeA impairs production of metabolites with associated antimicrobial properties. (a) RNA-sequencing results showed a significant downregulation of biosynthetic genes in the pseurotin putative gene cluster when laeA was deleted. (b) Organization of the putative pseurotin biosynthetic gene cluster in Penicillium sp. strain MB and log2 ratio of expression in MB_ΔlaeA. Gene names in bold are those known to be involved in pseurotin production in Aspergillus species. (c) Visualization of zones of inhibition of crude extracts collected from all four Penicillium isolates on YES medium against Brachybacterium alimentarium evaluated by the disk diffusion method. See Fig. S4 for additional zone of inhibition data for other bacterial species. (d) Volcano plots representing the number of analytes significantly regulated in MB_ΔlaeA compared to the MB_WT strain on YES medium. The blue dots indicate pseurotin A and the other putative pseurotins identified in this analysis. (e) Comparison of the peak area corrected values for pseurotin A and the other putative pseurotins between strains. Each bar represents the means with +/− one standard error, and each dot represents a biological replicate (n = 3). One-way analysis of variance (ANOVA) was performed for each Penicillium strain. Dunnett’s multiple comparison test was used and compared to the MB_WT strain. (**) indicates P < 0.01 and no asterisk indicates not significant (ns). (f) Inactivation of psoA led to loss of antibacterial activity and restored bacterial community composition. The compositions of MB_ΔpsoA-1 and MB_ΔpsoA-2 bacterial communities were not significantly different from one another but were different from Bacteria Alone and MB_WT (PERMANOVA F = 49.97, P < 0.0001). (g) Histograms showing the inhibition of community members grown in the presence of the four strains of Penicillium sp. strain MB at 10 days post-inoculation. Data are mean relative abundance from three independent experiments with five biological replications each. In the box plots, the bar represents the standard errors of the means and each dot represents a biological replication. One-way analysis of variance (ANOVA) was performed for each bacterial community. Dunnett’s multiple comparison test was used and compared to the WT strain. (****) indicates P < 0.0001, (***) indicates P < 0.001, (**) indicates P < 0.01, (*) indicates P < 0.05, and no asterisk indicates not significant (ns). For exact P-values for each treatment, see Data Set S1.

