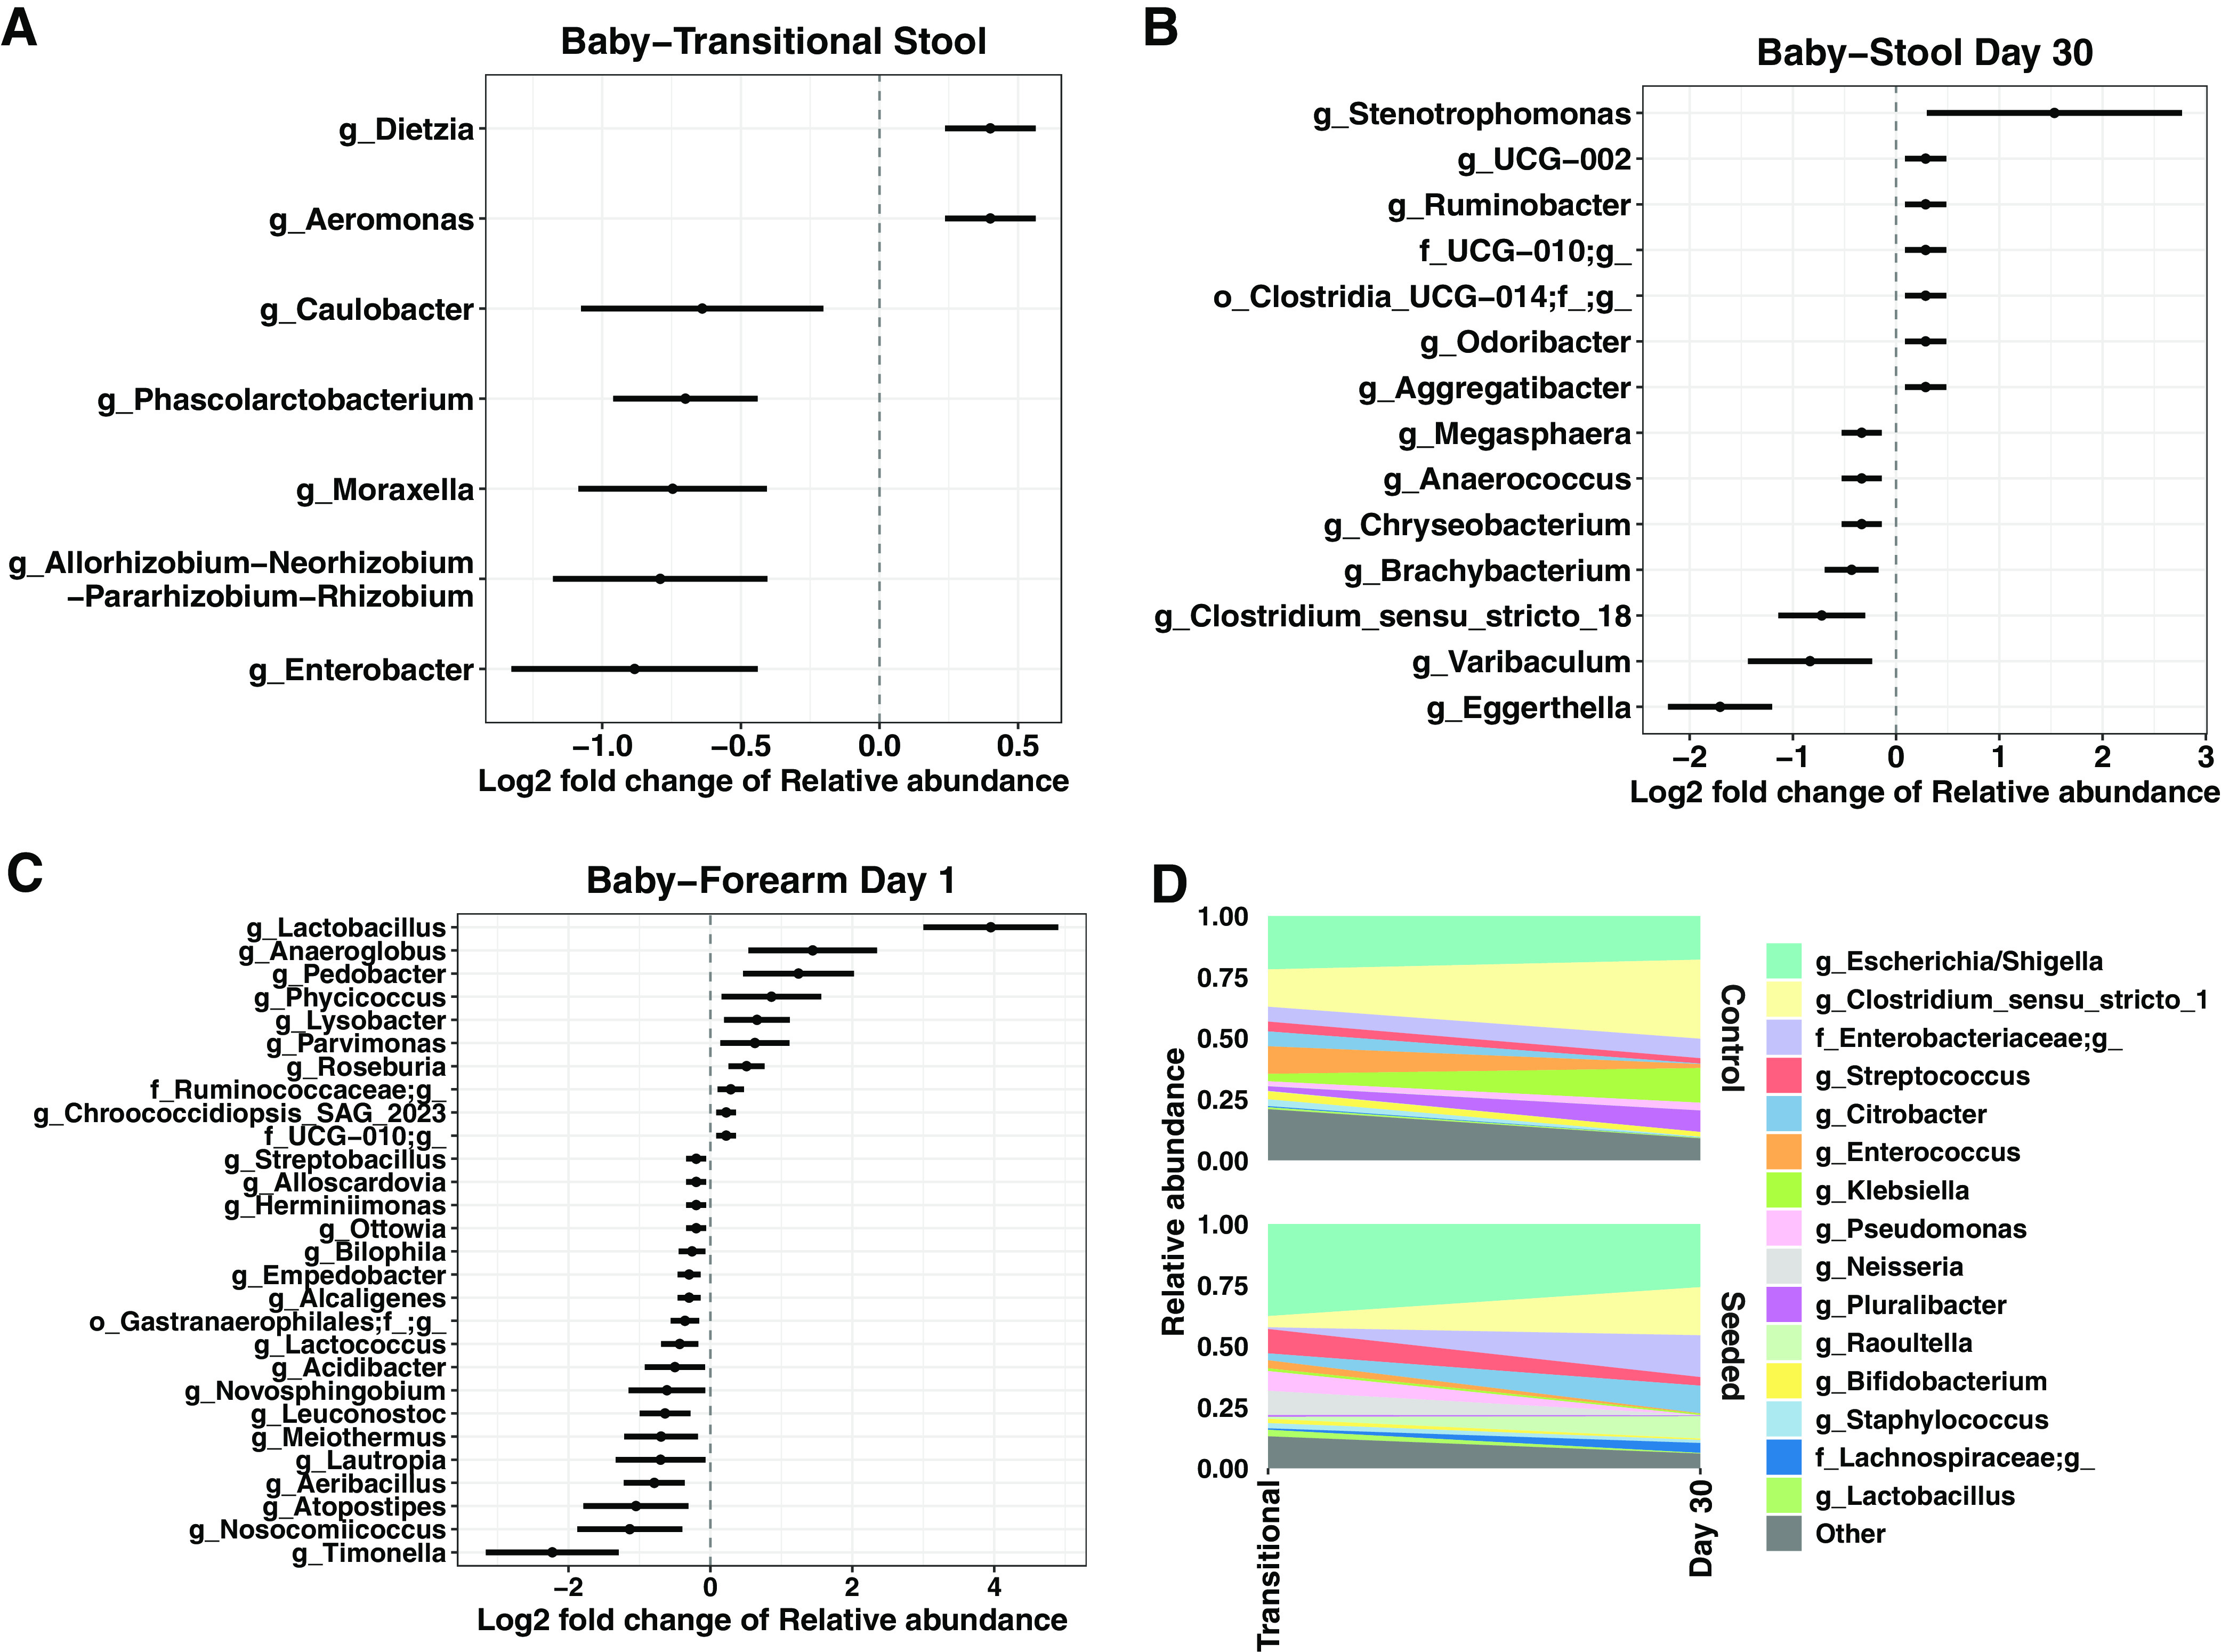
FIG 3.

Log2 fold differences of ASV relative abundance by treatment group in transitional stool (A), day 30 stool (B), and day 1 skin (C). The dots represent the mean log2 fold change of relative abundance compared with the control group; the bars indicate the standard error of log2 fold change. All taxa were detected as significantly different between treatment group by ANCOM with default parameters and with a threshold of 0.9 (i.e., >90% comparisons indicate that the significant taxa have different relative abundance between groups). (D) Change in the relative abundance of top 15 taxa at the genus level between infant transitional stool and day 30 stool by treatment group.
