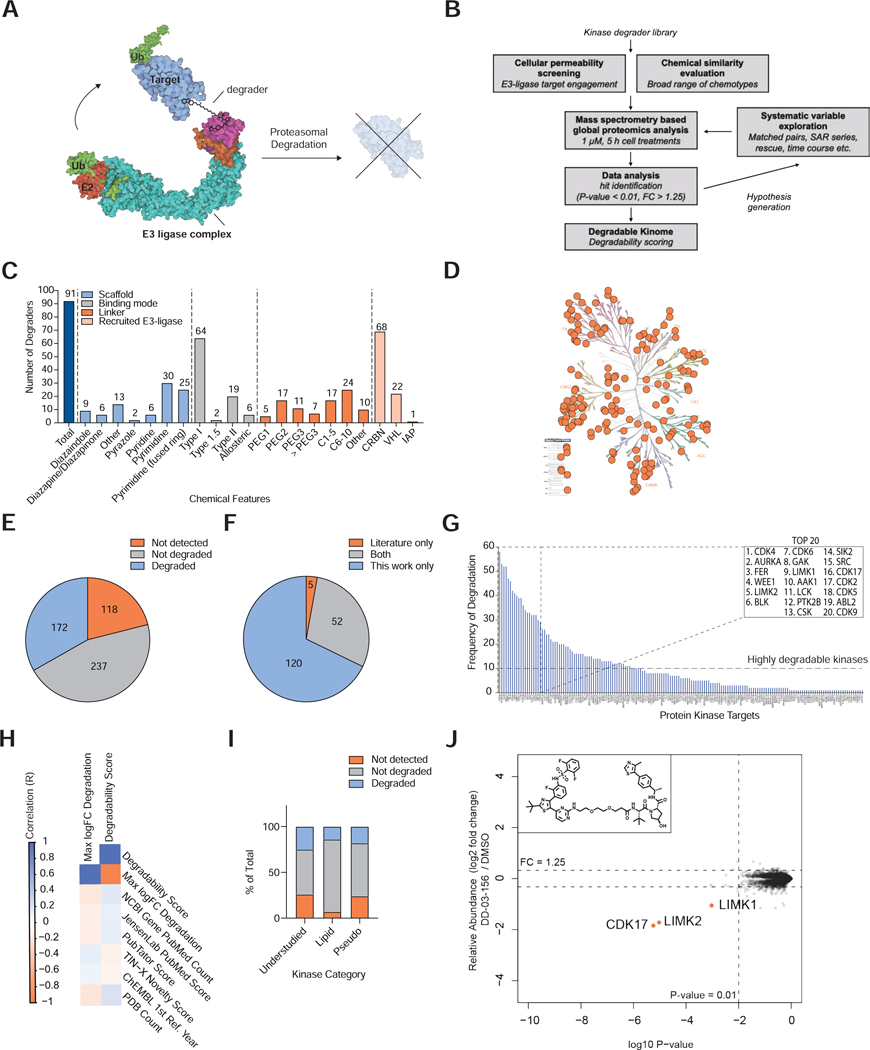
Figure 1 |. An Experimental Map of the Degradable Kinome.
(A) Mode of action of targeted protein degraders. (B) Experimental approach taken in this study. (C) Features of the profiled degrader library. Chemical structures reported in Table S1. (D) Kinome tree presenting protein kinases that were significantly downregulated by at least one degrader. Image created using KinMap, illustration reproduced courtesy of Cell Signaling Technology, Inc. (www.cellsignal.com). (E) Proportion of the human protein kinome detected and degraded by proteomics in at least one experiment. Data reported in Table S1, 4. (F) Comparison of degraded kinase targets reported in the literature and in this study. Literature searching was performed in PubMed, using search terms ‘kinase PROTAC’ and ‘kinase degrader’. Data reported in Table S5. (G) The number of independent compound treatments for which degradation was observed for each kinase. Inset, the top 20 most frequently degraded kinases. (H) Comparison of kinase degradability score with PubMed Count and PDB count. (I) Proportion of understudied kinases, lipid kinases and pseudokinases detected and degraded by proteomics in at least one experiment in this study. Data reported in Tables S4. (J) Scatterplot displaying relative fold change in protein abundance following treatment of MOLT-4 cells with 1 μM DD-03–156 for 5 h. Inset, chemical structure of DD-03-156. Data are from n = 1 biologically independent treatment samples. The associated dataset is provided in Table S3-4.

