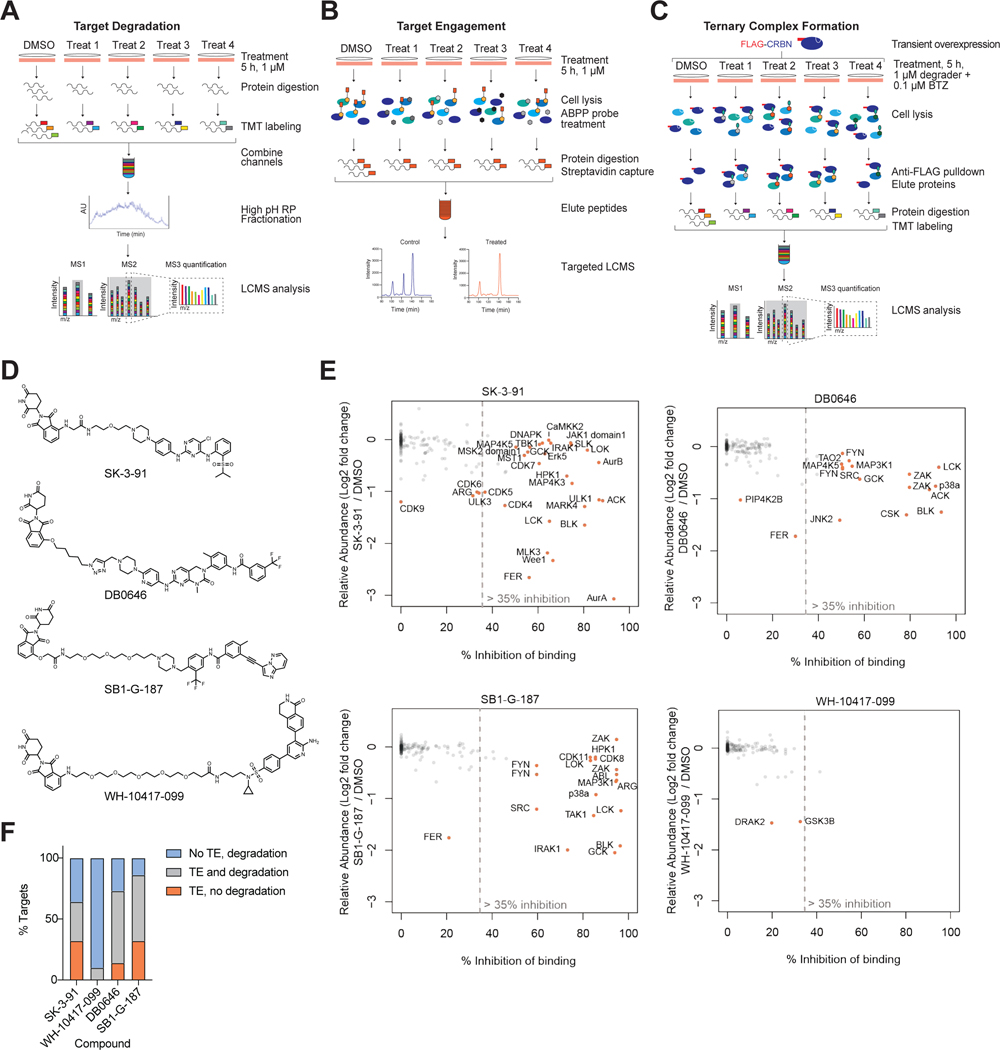
Figure 3 |. Cellular Target Engagement Does Not Predict Degradation Efficiency.
Multiplexed TMT-based quantitative proteomics workflow used in this study. (B) ABPP-based KiNativ proteomics workflow used for target engagement measurements. (C) AP-MS approach used to enrich for degrader-mediated ternary complexes with CRBN. (D) Chemical structures of the 4 multitargeted degrader probes. (E) Scatterplot comparing kinase engagement (KiNativ, B) with kinase degradation (proteomics, A). KiNativ data are from n = 2 technically independent samples, proteomics analysis data are from n = 1 biologically independent treatment samples. Associated datasets are provided in Table S3, 4, 6. Negative KiNativ values were interpreted as 0% inhibition of binding. (F) Bar chart showing the proportion of degraded kinase targets for which detectable target engagement (TE, > 35% inhibition of binding) and degradation (FC > 1.25, P-value < 0.01) were observed for the 4 compounds tested.

