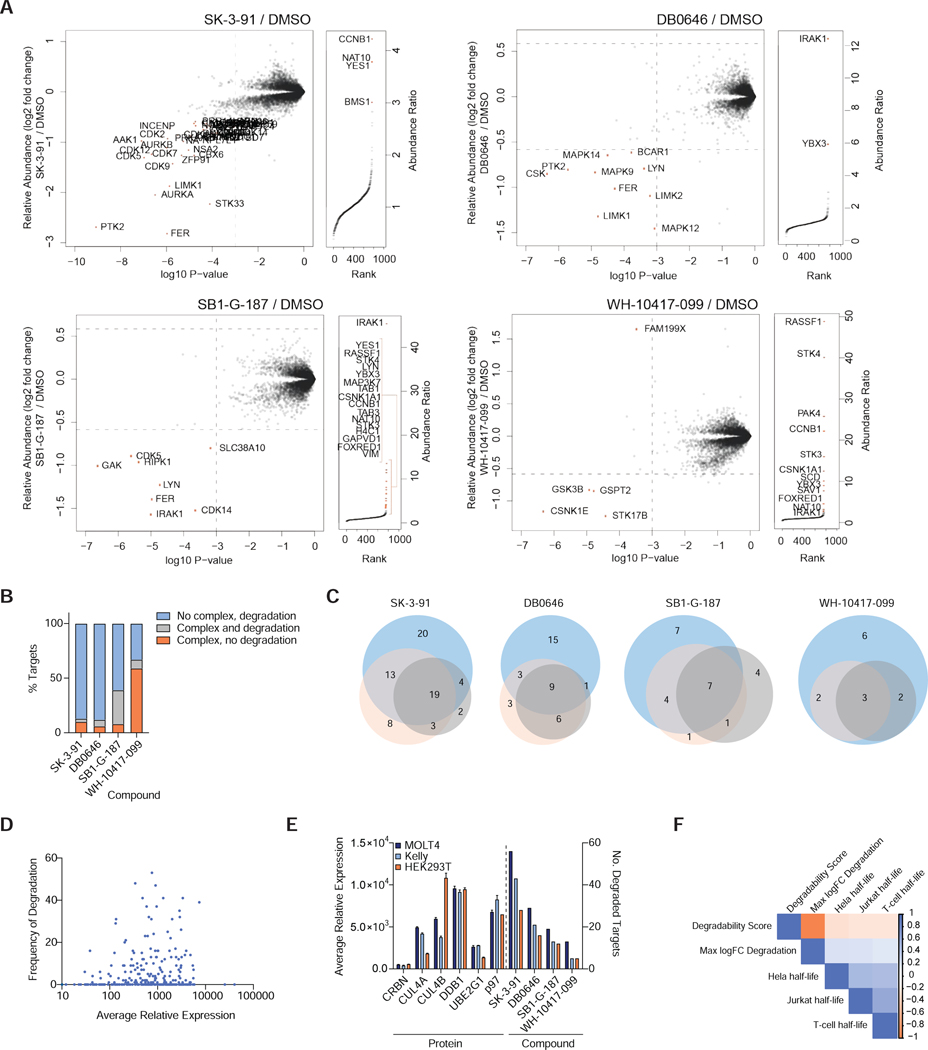
Figure 4 |. Effects of ternary complex formation and target protein abundance on degrader efficacy.
(A) Left. Scatterplot depicts relative fold change in protein abundance following treatment of HEK293T cells (See Fig. 3A). Right. Rank order plot showing the ranked relative abundance ratios of enriched proteins in FLAG-CRBN AP-MS experiments from HEK293T cells (see Fig. 3C). Data in scatterplots are from n = 2 biologically independent treatment samples. Data in rank order plots are from n = 3 biologically independent treatment samples. Associated datasets are provided in Tables S3, 7, 6. (B) Bar chart depicting the proportion of targets complexed and degraded by the indicated compounds. (C) Venn diagrams showing number of unique and overlapping kinase hits found for each compound in MOLT-4 (blue), KELLY (orange) and HEK293T (gray) cells. (D) Kinome wide comparison of the degradation frequency and the relative protein abundance in MOLT-4 cells. (E) Bar plot showing the average relative expression the indicated proteins (left) and number of kinases degraded by the indicated degraders (right) in MOLT-4, KELLY and HEK293T cells. Average abundance measurements were derived from n = 2 independent biological samples. Associated datasets are provided in Tables S2. (F) Correlation of kinase degradability score and reported protein half-life in listed cell types.

