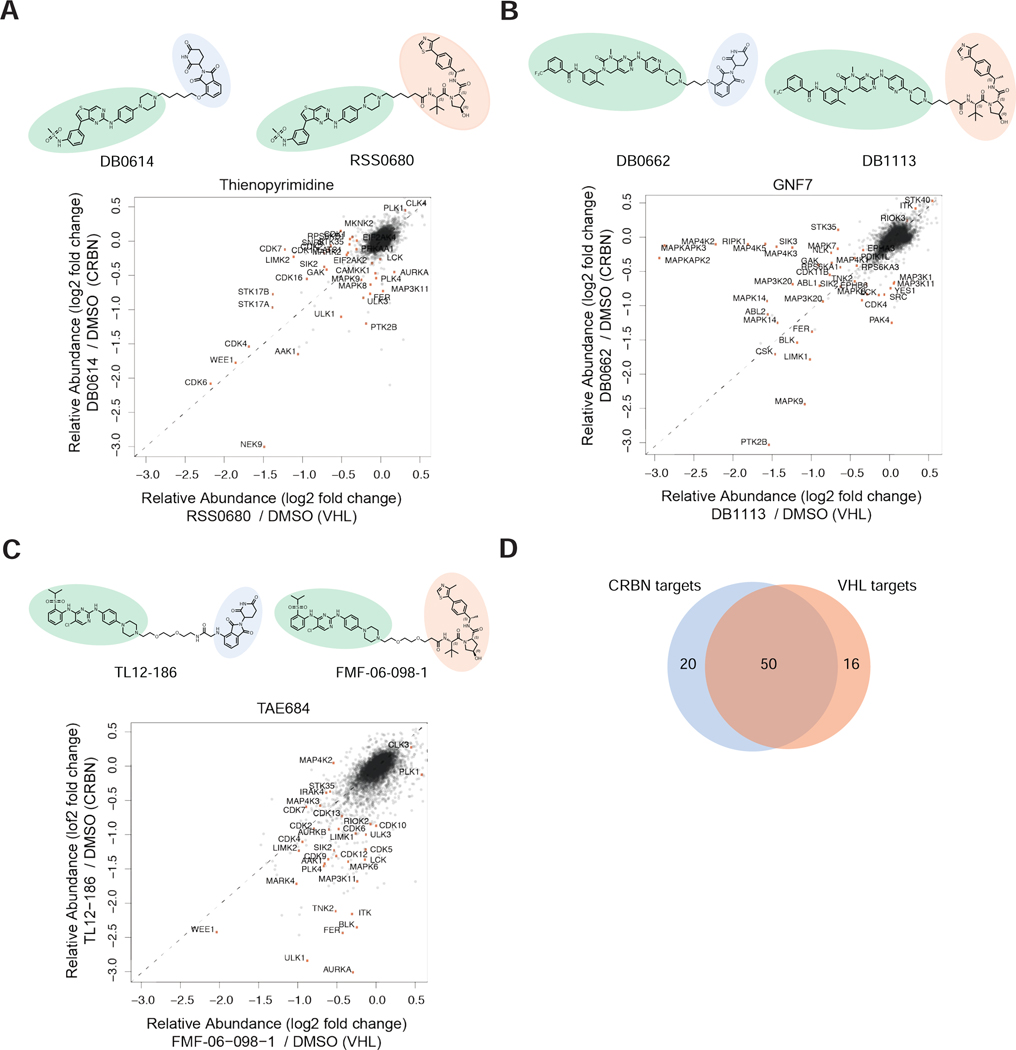
Figure 5 |. Varying the target recruiting ligase can influence degrader selectivity.
(A-C) Chemical structures and scatterplot log2 FC pairwise comparisons from treatment with VHL vs CRBN degrader pairs. Relative fold change in protein abundance measurements were determined from global quantitative proteomics experiments (Fig. 3C). Quantitative proteomics analysis data are from n = 2 biologically independent treatment samples. (D) Venn diagram illustrating the target overlap for the aggregated data in A, for lists see Table S9.

