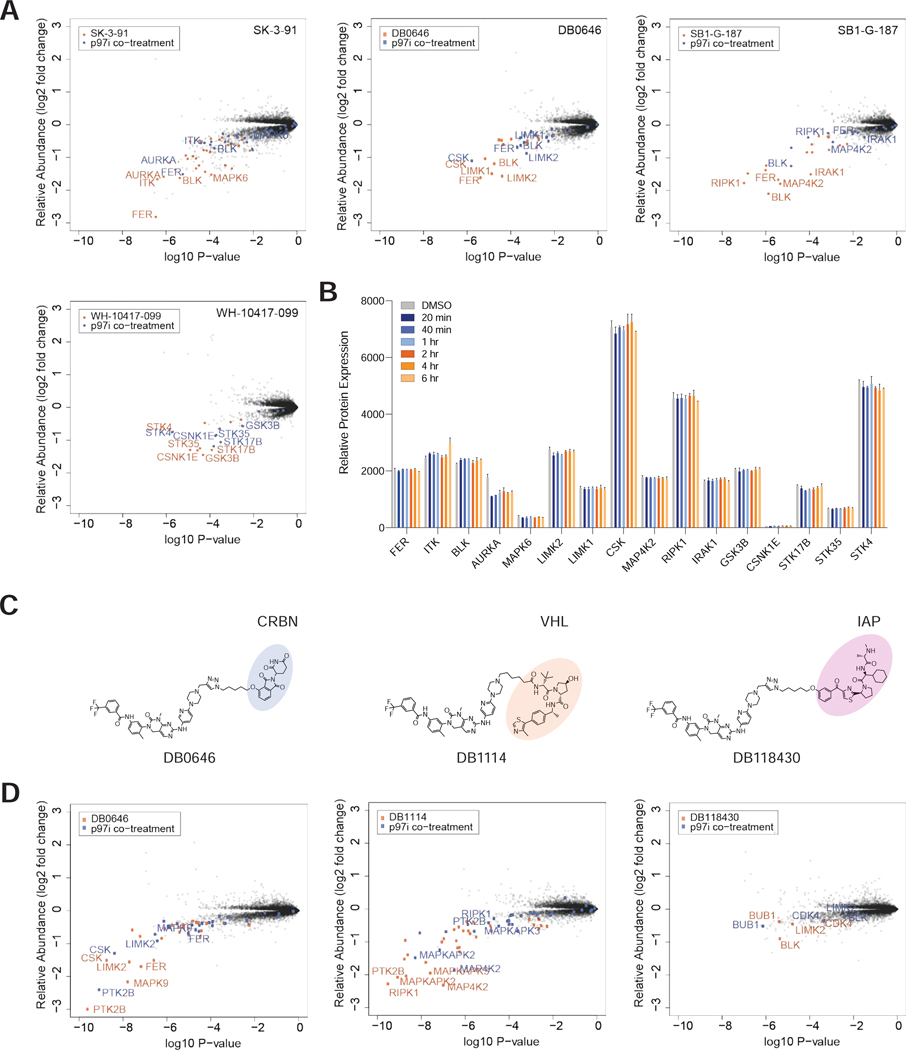
Figure 7 |. Proteasomal degradation of most kinases is p97 dependent.
(A) Scatterplots depicting the fold change in relative abundance following a 5 h treatment of MOLT-4 cells with 1 μM of the indicated compounds with (blue) and without (orange) co-treatment with 5 μM of p97 inhibitor CB-5083. Relative expression data are derived from n = 2 biologically independent treatment. Datasets are provided in Table S3. (B) Bar chart comparing the relative protein abundance of the top 5 degraded kinases from each of the indicated treatments in A. Bars indicate relative protein expression in response to inhibition of p97 with 5 μM of CB-5083, over a time course experiment in MOLT-4 cells. Relative expression data are represented as mean ± s.d. of from n = 2 biologically independent treatment. (C) Chemical structures of GNF7-based kinase degraders utilizing either a CRBN, VHL or IAP binding moiety. (D) As in A but for compounds indicated in C. (A-D) Datasets are provided in Table S3.

