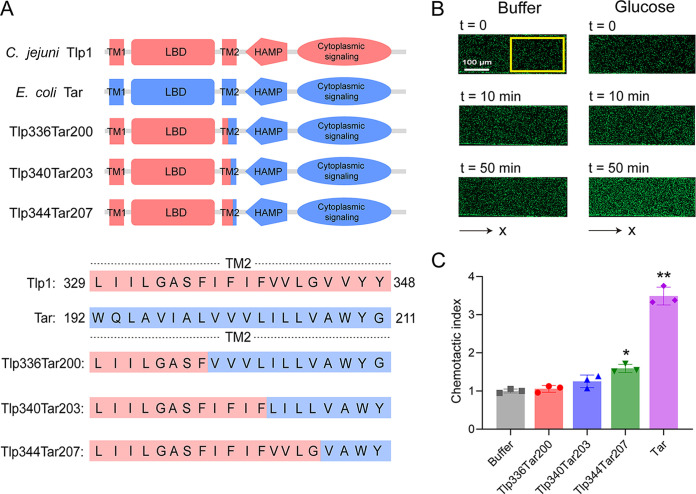
FIG 1.
Design and construction of the functional Tlp1-Tar hybrid chemoreceptors. (A) Design and construction of the hybrid receptors Tlp336Tar200, Tlp340Tar203, and Tlp344Tar207. The upper panel shows the architecture of Tlp1 (red), Tar (blue), and the Tlp1-Tar hybrid receptor with a periplasmic LBD, two transmembrane helixes (TM1, TM2), HAMP domain, and cytoplasmic signaling domain. The lower panel shows the sequence alignment for Tlp1 and Tar, shown in red and blue, respectively, with the sequences of the hybrid receptors given below. (B) Examples of the distribution of E. coli cells expressing Tlp344Tar207 in the observation channel of the microfluidic device, acquired before the addition of ligands as well as 10 min and 50 min after the addition of 30 mM glucose at the source pore (scale bar: 100 μm). The x component (black arrow) indicates the direction up the concentration gradient of glucose. The response is characterized by measurements of the fluorescence intensity (cell density) in the analysis region (150 × 300 μm) of the observation channel, which is indicated by a yellow rectangle. (C) Relative fluorescence intensities of the cells expressing Tlp336Tar200, Tlp340Tar203, Tlp344Tar207, or Tar as the sole receptor in the analysis region of the observation channel at 50 min after the addition of glucose at the source or without ligand (buffer). The corresponding values of the fluorescence intensities in the analysis regions were normalized to the fluorescence intensity of the cells in the buffer to obtain the chemotactic index values. Error bars indicate the standard errors of three replicates. The P values were calculated using a paired t test. *, P < 0.05; **, P < 0.01, compared to the buffer. LBD, ligand-binding domain; HAMP, histidine kinases, adenylate cyclases, methyl-accepting proteins, and phosphatases.

